Zeit- und Frequenzbereichanalyse
Mit den Befehlen zur Zeit- und Frequenzbereichanalyse können Sie Systemantworten von SISO- und MIMO-Systemen wie Bode-Diagramme, Nichols-Diagramme, Sprungantworten und Impulsantworten berechnen und visualisieren. Sie können auch Systemeigenschaften wie Anstiegszeit und Einschwingzeit, Überschwingen und Stabilitätsreserven extrahieren. Informationen für den Einstieg in die Erstellung von Antwortdiagrammen finden Sie unter Plotting System Responses. Weitere Informationen zum Anpassen von Antwortdiagrammen finden Sie unter Anpassung von Diagrammen.
Funktionen
Apps
| Linear System Analyzer | Analyze time-domain and frequency-domain responses of linear time-invariant (LTI) systems |
Tools
| Linear Simulation Tool | Specify input signals and initial conditions for simulating linear models with arbitrary input signals and initial conditions |
Live Editor Tasks
| Diagramm erstellen | Interactively create linear analysis response plots in the Live Editor (Seit R2022b) |
Blöcke
| LTI System | Verwendung zeitinvarianter Systemmodellobjekte in Simulink |
Themen
Grundlagen von Analysediagrammen
- Plotting System Responses
This example shows an overview of generating time-domain and frequency-domain response plots.
Zeitbereichsanalyse
- Time-Domain Responses
Generate and visualize time-response data such as step response and impulse response.
- Time-Domain Characteristics on Response Plots
Visualize time-domain system characteristics such as settling time and overshoot on response plots. - Numeric Values of Time-Domain System Characteristics
Use thestepinfofunction to obtain numeric values of step response characteristics such as rise time, settling time, and overshoot.
Frequenzbereichanalyse
- Frequency-Domain Responses
Generate and visualize frequency-response data such as Bode plots and Nichols plots.
- Frequency-Domain Characteristics on Response Plots
Visualize frequency-domain system characteristics such as peak response on plots. - Numeric Values of Frequency-Domain Characteristics of SISO Model
Obtain numeric values of frequency-domain characteristics such as peak gain, dc gain, and system bandwidth.
Linear System Analyzer
- Joint Time-Domain and Frequency-Domain Analysis
Compare multiple types of responses side by side, including both time-domain and frequency-domain responses, using the Linear System Analyzer app. - Analyzing MIMO Models
In analysis plots of multiple-input, multiple output LTI models, there are plot tools for selecting subsystems and grouping I/O pairs.
Systeme mit Zeitverzögerungen
- Analyze Dynamic Systems with Time Delays
The time and frequency responses of delay systems can have features that can look odd to those only familiar with delay-free LTI analysis. - Analyze Control Systems with Delays
Many processes involve dead times, also referred to as transport delays or time lags. Controlling such processes is challenging because delays cause phase shifts that limit the control bandwidth and affect closed-loop stability. - Validate Simulation Results for Models with Internal Delays
Validate the accuracy of simulations with internal delays by varying sample time. (Seit R2026a)
Verwandte Informationen
Enthaltene Beispiele
Analyse der Antwort einer RLC-Schaltung
Analysieren Sie die Zeit und die Frequenzgänge eines Systems zweiter Ordnung.
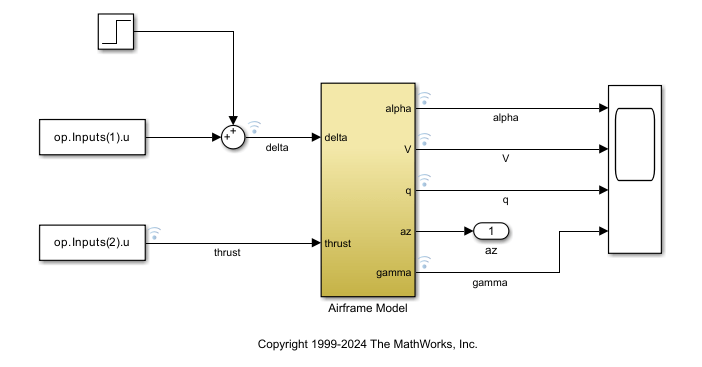
Use Linearization Offsets to Help Compare Nonlinear and Linearized Responses
Use offsets from linearization to facilitate the comparison of the nonlinear and linearized responses of a Simulink model.
Unterrichtsmaterialien

Transferfunktionsanalyse dynamischer Systeme
Lernen Sie, wie Sie Transferfunktionen berechnen und mithilfe von Polstellen, Nullstellen und Bodediagrammen analysieren können.