temporalCount
Anzahl der Ereignisse, Diagramm-Ausführungen oder Zeit seit Aktivierung des Zustands
Beschreibung
temporalCount( gibt an, wie oft das Ereignis E)E aufgetreten ist, seit der assoziierte Zustand aktiviert wurde.
temporalCount( gibt an, wie oft das Diagramm aufgeweckt wurde, seit der assoziierte Zustand aktiviert wurde.tick)
Das implizite Ereignis tick wird nicht unterstützt, wenn ein Stateflow®-Diagramm in einem Simulink®-Modell über Eingangsereignisse verfügt.
temporalCount( gibt aus, wie viel Zeit seit der Aktivierung des assoziierten Zustands vergangen ist. Legen Sie time_unit)time_unit als Sekunden (sec), Millisekunden (msec) oder Mikrosekunden (usec) fest.
Hinweis
Eigenständige Stateflow-Diagramme in MATLAB® unterstützen temporalCount nur als Operator für Absolutzeit-basierte temporale Logik.
Beispiele
Greift jedes Mal, wenn das Diagramm eine Übertragung des Ereignisses E verarbeitet, auf aufeinanderfolgende Elemente des Arrays M zu.
Geben Sie bei Diagrammen in einem Simulink-Modell Folgendes ein:
on E:
   y = M(temporalCount(E));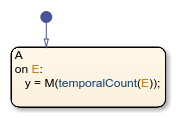
Die Verwendung von temporalCount als ereignisbasierter temporaler Logikoperator wird in MATLAB bei eigenständigen Diagrammen nicht unterstützt.
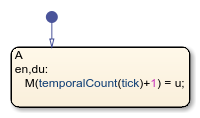
Speichert den Wert der Eingangsdaten u in aufeinanderfolgenden Elementen des Arrays M.
Geben Sie bei Diagrammen in einem Simulink-Modell Folgendes ein:
en,du:
   M(temporalCount(tick)+1) = u;
Die Verwendung von temporalCount als ereignisbasierter temporaler Logikoperator wird in MATLAB bei eigenständigen Diagrammen nicht unterstützt.
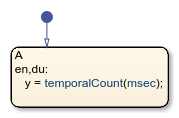
Speichert die Anzahl von Millisekunden, seit der Zustand aktiviert wurde.
en,du:
   y = temporalCount(msec);
Tipps
Sie können Anführungszeichen für die Schlüsselwörter
'tick','sec','msec'und'usec'verwenden. Zum Beispiel isttemporalCount('tick')äquivalent zutemporalCount(tick).Das Stateflow-Diagramm setzt den vom Operator
temporalCountverwendeten Zähler immer dann zurück, wenn der zugeordnete Zustand erneut aktiviert wird.Das Timing für temporale Logikoperatoren der Absolutzeit hängt vom Typ des Stateflow-Diagramms ab:
Diagramme in einem Simulink-Modell definieren die temporale Logik in Bezug auf die Simulationszeit.
Eigenständige Diagramme in MATLAB definieren die temporale Logik in Bezug auf die Istzeit.
Die Differenz im Timing kann das Verhalten eines Diagramms beeinflussen. Angenommen, dieses Diagramm führt beispielsweise die Aktion vom Typ
entrydes ZustandsAaus.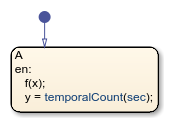
In einem Simulink-Modell wird der Funktionsaufruf von
fin einem einzigen Zeitschritt ausgeführt und hat keinen Einfluss auf die Simulationszeit. Nach Aufrufen derf-Funktion weist das Diagrammyeinen Wert von null zu.In einem eigenständigen Diagramm kann der Funktionsaufruf von
fmehrere Sekunden Istzeit dauern. Nach Aufrufen derf-Funktion weist das Diagrammydie Zeit (nicht null) zu, die vergangen ist, seitAaktiviert wurde.
Versionsverlauf
Eingeführt in R2008a