Ausführung in MATLAB
Entwerfen Sie die Logik mithilfe von Statecharts und führen Sie diese Logik als MATLAB-Programme aus. Führen Sie Ihr Diagramm im Stateflow-Editor aus und testen Sie es. Steuern Sie das Verhalten von Benutzerschnittstellen und Datenverarbeitungsanwendungen über Ihr Diagramm.
Funktionen
Stateflow Syntax
Themen
- Create Stateflow Charts for Execution as MATLAB Objects
Save standalone Stateflow charts outside of Simulink® models.
- Execute and Unit Test Stateflow Chart Objects
Run Stateflow charts in MATLAB or through the Stateflow Editor.
- Execute Stateflow Chart Objects Through Scripts and Models
Create a MATLAB script or a Simulink model that invokes a standalone Stateflow chart.
- Umwandlung von MATLAB-Code in Stateflow-Flussdiagramme
Erstellen von Flussdiagrammen aus Ihrem MATLAB-Code.
Fehlersuche
Debug a Standalone Stateflow Chart
Interrupt execution to step through each action in a Stateflow chart.
Verwandte Informationen
Enthaltene Beispiele
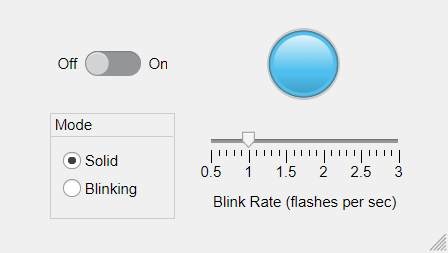
Entwerfen einer Mensch-Maschine-Schnittstellenlogik mithilfe von Stateflow-Diagrammen
Modellieren Sie die Logik einer Lampen-App in einem eigenständigen Stateflow-Diagramm.

Model a Communications Protocol by Using Chart Objects
Use a standalone Stateflow® chart to model a frame-synchronization and symbol-detection component in a communications system. Standalone charts implement classic chart semantics with MATLAB® as the action language. You can program the chart by using the full functionality of MATLAB, including those functions that are restricted for code generation in Simulink®. For more information, see Create Stateflow Charts for Execution as MATLAB Objects.

Implement a Financial Strategy by Using Stateflow
Use a standalone Stateflow® chart to model a financial trading strategy known as Bollinger Bands. Standalone charts implement classic chart semantics with MATLAB® as the action language. You can program the chart by using the full functionality of MATLAB, including those functions that are restricted for code generation in Simulink®. For more information, see Create Stateflow Charts for Execution as MATLAB Objects.

Model a Fitness App by Using Standalone Charts
Implement a fitness tracker by using multiple standalone charts and a MATLAB app.

Model Bluetooth Low Energy Link Layer Using Stateflow
Use a standalone Stateflow chart to model the state machine in a Bluetooth® low energy link layer.
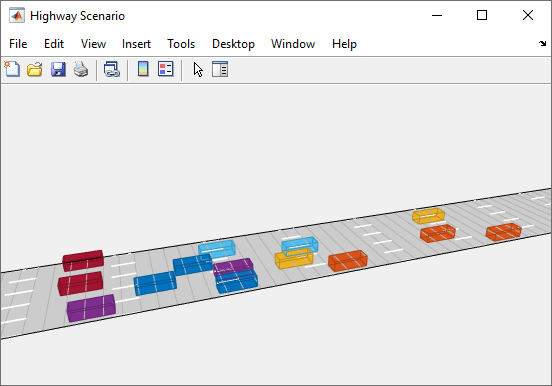
Automate Control of Intelligent Vehicles by Using Stateflow Charts
Model a highway scenario with intelligent vehicles that are controlled by the same decision logic.
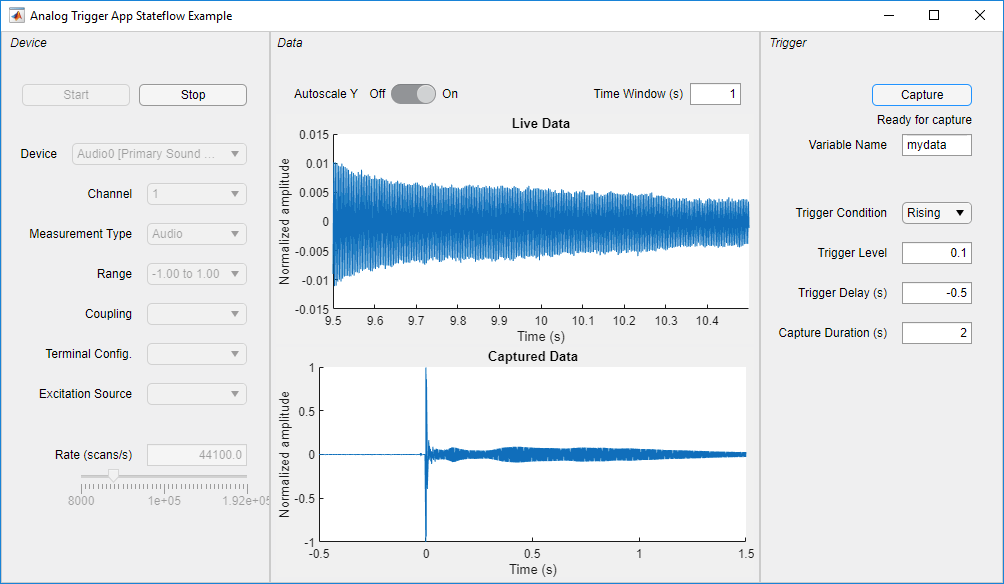
Analog Triggered Data Acquisition Using Stateflow Charts
Create an analog-triggered data acquisition app by using Stateflow, Data Acquisition Toolbox™, and App Designer.

Pick-and-Place Workflow Using Stateflow for MATLAB
Design a pick-and-place workflow for a robotic manipulator such as Kinova® Gen3 using Stateflow.