Deskriptive Statistik
Verwenden Sie findpeaks, um die lokalen Maxima eines Signals zu lokalisieren und die Spitzen nach Höhe, Breite oder Prominenz zu sortieren. Ermitteln Sie den Scheitelfaktor eines Signals mithilfe der Funktion peak2rms und berechnen Sie gängige deskriptive Statistiken wie Maxima, Minima, Standardabweichungen und RMS-Werte. Suchen Sie in größeren Datensätzen nach relevanten Signalen und gleichen Sie diese zeitlich ab. Ermitteln Sie Punkte, an denen sich ein Signal abrupt ändert oder außerhalb der Zielreichweite abdriftet. Signale für Analyse- oder Machine-Learning-Anwendungen kennzeichnen.
Apps
| Signal Analyzer | Mehrere Signale und Spektren visualisieren und vergleichen |
| Signal Labeler | Label signal attributes, regions, and points of interest |
| Signal Feature Extractor | Extract and analyze signal features (Seit R2025a) |
Funktionen
Themen
- Use Signal Feature Extractor App
Extract and rank features from signals interactively. Prepare signal datasets for classification tasks.
- SCHRITT 1: Import Data into Signal Feature Extractor
- SCHRITT 2: Feature Extraction Using Signal Feature Extractor
- SCHRITT 3: Rank Features Using Signal Feature Extractor
- SCHRITT 4: Export Labeled Signal Sets and Features
- RMS Value of Periodic Waveforms
Find the root mean square value of a sine wave, a square wave, and a rectangular pulse train.
- Find Peaks in Data
Locate the local maxima in a set of data and determine if those peaks occur periodically.
- Prominence
The prominence of a peak measures how much the peak stands out due to its intrinsic height and its location relative to other peaks.
- Human Activity Recognition Simulink Model for Smartphone Deployment (Statistics and Machine Learning Toolbox)
Generate code from a classification Simulink® model prepared for deployment to a smartphone.
- Choose an App to Label Ground Truth Data
Decide which app to use to label ground truth data: Image Labeler, Video Labeler, Ground Truth Labeler, Lidar Labeler, Signal Labeler, or Medical Image Labeler.
Enthaltene Beispiele
Measure Signal Similarities
Compare signals with different sample rates or frequency content, measure delays, and determine if there is a signal in a measurement.
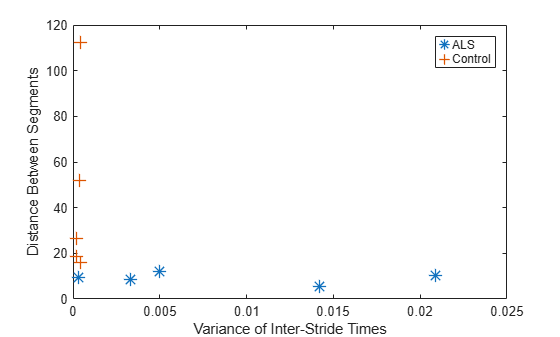
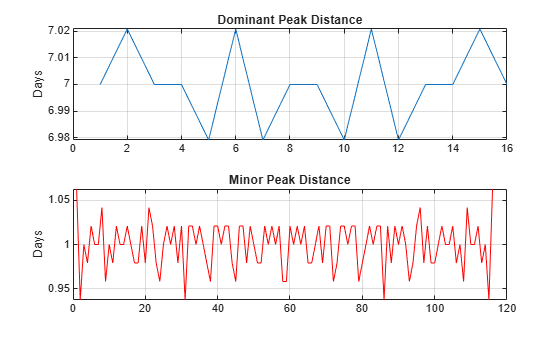
Extract Classification Features from Physiological Signals
Quantify interstride time intervals and measure walking-pattern similarity; construct a feature vector to classify signals.

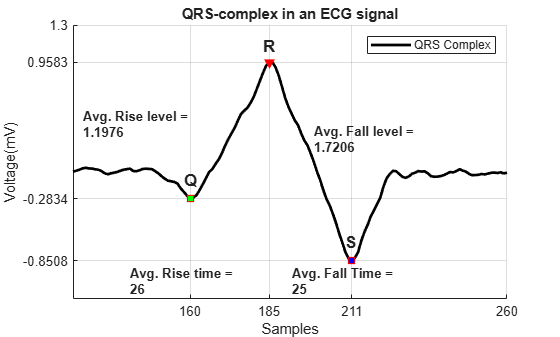
Automate Signal Labeling with Custom Functions
Use Signal Labeler to locate and label QRS complexes and R peaks of ECG signals.

Label Spoken Words in Audio Signals
Use Signal Labeler to label spoken words in an audio signal.

Label Signal Attributes, Regions of Interest, and Points
Use Signal Labeler to label attributes, regions, and points of interest in a set of whale songs.
Peak Analysis
Find peaks in a noisy signal and measure their amplitude and the distance between them.
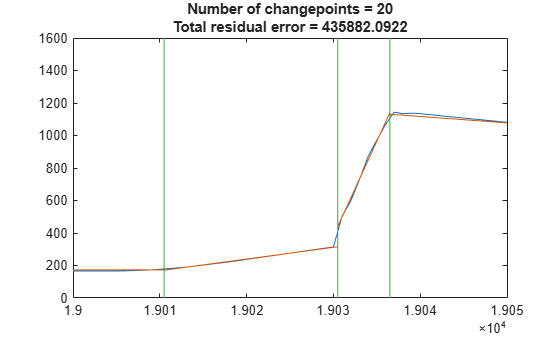
Detect Outbreaks and Significant Changes in Signals
Determine significant changes or outbreaks in signals using cumulative sums and changepoint detection.
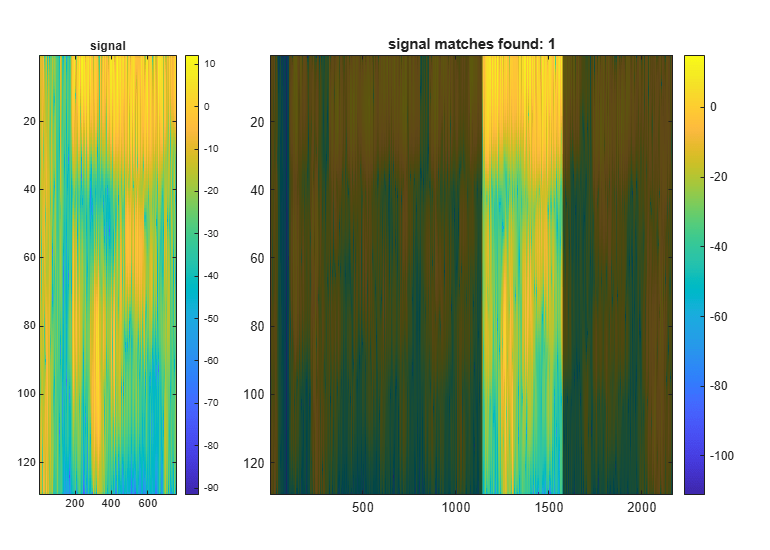
Finding a Signal in Data
Find exactly and closely matching signals and allow for variations in sampling by warping the time axis.