Darstellen von Betriebsmodi durch Verwendung von Zuständen
Ein Zustand beschreibt einen Betriebsmodus eines reaktiven Systems. In einem Stateflow®-Diagramm werden Zustände für sequenzielle Entwürfe verwendet, um Zustandsübergangs-Diagramme zu erstellen.
Während der Simulation können Zustände aktiv oder inaktiv sein. Die Aktivität eines Zustands ändert sich je nach Ereignissen und Bedingungen. Ereignisse steuern die Ausführung des Zustandsübergangsdiagramms, indem Zustände aktiv oder inaktiv geschaltet werden. Weitere Informationen finden Sie unter Ausführung eines Stateflow-Diagramms.
Um mehrere Komponentenebenen in einem System darzustellen, erstellen Sie eine Zustandshierarchie, indem Sie Unterzustände in Superzuständen verschachteln. Weitere Informationen finden Sie unter Verwenden der Zustandshierarchie zur Gestaltung einer mehrschichtigen Zustandskomplexität.
Um einander ausschließende Betriebsmodi zu modellieren, aktivieren Sie die exklusive (OR) Dekomposition in einem Zustand, sodass höchstens ein Unterzustand zugleich aktiv sein kann. Um gleichlaufende Betriebsmodi zu implementieren, aktivieren Sie die parallele (AND) Dekomposition in einem Zustand, sodass alle Unterzustände zugleich aktiv sein können. Weitere Informationen finden Sie unter Definieren exklusiver und paralleler Modi durch Verwendung von Zustandsdekomposition.
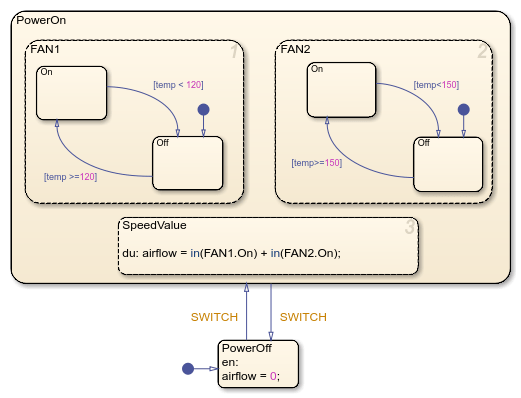
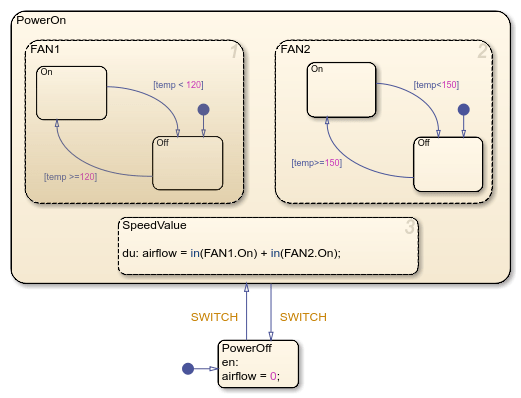
In diesem Beispiel stellen die Zustände PowerOn und PowerOff die Ein- und Aus-Modi eines Luftregelsystems dar. Im Zustand PowerOn stellen die parallelen Unterzustände FAN1 und FAN2 die Betriebsmodi eines Ventilatorpaars dar. Diese Zustände enthalten exklusive Unterzustände namens On und Off. Weitere Informationen zu diesem Beispiel finden Sie unter Paralleles Ausführen von Zuständen.
Erstellen eines Zustands
Um einem Stateflow-Diagramm einen Zustand hinzuzufügen:
Öffnen Sie das Diagramm.
Klicken Sie in der Objektpalette auf das Zustandssymbol
 .
.Klicken Sie dann im Diagrammzeichenbereich auf die Stelle, an der Sie den neuen Zustand platzieren möchten.
Geben Sie eine Kennzeichnung für den Zustand ein und klicken Sie außerhalb des Zustands. Die Kennzeichnung gibt den Namen des Zustands und weitere optionale Aktionen an, die der Zustand während der Simulation ausführt. Weitere Informationen finden Sie unter Definieren von Aktionen in einem Zustand.
Haben Sie einen Zustand erstellt, können Sie mit dem Stateflow Editor die Größe, Position und den Inhalt des Zustands ändern:
Um die Größe des Zustands zu ändern, klicken und ziehen Sie die Ecke des Zustands.
Um den Zustand zu verschieben, klicken und ziehen Sie das Innere des Zustands.
Um die Zustandskennzeichnung zu bearbeiten, klicken Sie auf die Kennzeichnung neben der Zeichenposition, die Sie bearbeiten möchten.
Tipp
Ein übergeordneter Zustand muss grafisch groß genug sein, um alle Unterzustände zu umfassen; daher müssen Sie ggf. die Größe eines übergeordneten Zustands ändern, bevor Sie einen Unterzustand in diesen ziehen. Alternativ können Sie einen Superzustand in ein Unterdiagramm umwandeln. Weitere Informationen finden Sie unter Encapsulate Modal Logic by Using Subcharts.
Definieren von Aktionen in einem Zustand
Die Kennzeichnung eines Zustands gibt den Namen des Zustands und weitere optionale Aktionen an, die der Zustand während der Simulation ausführt. Eine Zustandskennzeichnung erscheint in der oberen linken Ecke des Zustands und weist das folgende allgemeine Format auf:
name
entry: entry_actions
during: during_actions
exit: exit_actions
on event_name: on_event_actions
on message_name: on_message_actions
bind: event_name, data_name
Zustandsaktionen können in beliebiger Reihenfolge angezeigt werden. Bei jedem Aktionstyp können Sie mehrere Ausdrücke angeben, indem Sie jeden Ausdruck in eine eigene Zeile eingeben. Alternativ können Sie mehrere Ausdrücke in einer Zeile durch Kommas oder Semikolone trennen. Sie können zudem entry-, during- und exit-Aktionen kombinieren, die dieselben Ausdrücke ausführen. Weitere Informationen finden Sie unter Beseitigen von überflüssigem Code durch Kombinieren von Zustandsaktionen.
Tipp
Wenn Sie Ausdrücke direkt nach dem Zustandsnamen hinzufügen, interpretiert das Diagramm diese Ausdrücke als kombinierte entry- und during-Aktionen.
Zustandsname
Eine Zustandskennzeichnung beginnt mit dem Namen des Zustands, gefolgt von einem optionalen Schrägstrich (/). Zustandsnamen beachten Klein- und Großschreibung und bestehen aus einer Kombination alphanumerischer Zeichen und Unterstriche. Weitere Informationen finden Sie unter Anleitung zur Benennung von Stateflow-Objekten.
Um Namenskonflikte zu vermeiden, weisen Sie benachbarten Zuständen nicht denselben Namen zu. Sie können jedoch für mehrere Zustände denselben Zustandsnamen verwenden, wenn der vollständige Name jedes Zustands einzigartig ist. Der vollständige Name eines Zustands umfasst die Sequenz an Vorgängernamen in der Zustandshierarchie, getrennt durch Punkte. Im vorherigen Beispiel sind die Zustände in FAN1 und FAN2 durch diese einzigartigen vollständigen Namen gekennzeichnet:
PowerOn.FAN1.OnPowerOn.FAN1.OffPowerOn.FAN2.OnPowerOn.FAN2.Off
„Entry“-Aktionen
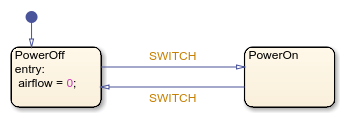
Um eine entry-Aktion hinzuzufügen, geben Sie entry oder en ein, gefolgt von einem Doppelpunkt (:) und einem oder mehreren Ausdrücken. Das Diagramm führt diese Ausdrücke aus, wenn der Zustand aktiv wird. In diesem Diagramm setzt beispielsweise die entry-Aktion im Zustand PowerOff den Wert von airflow auf null, wenn das Luftregelsystem ausgeschaltet wird. Weitere Informationen finden Sie unter Eintreten in Diagramme oder Zustände.
„During“-Aktionen
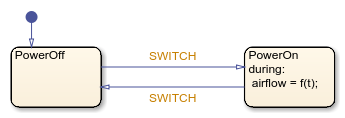
Um eine during-Aktion hinzuzufügen, geben Sie during oder du gefolgt von einem Doppelpunkt (:) und einem oder mehreren Ausdrücken ein. Das Diagramm führt diese Ausdrücke aus, wenn der Zustand aktiv ist und keine gültigen Übergänge zu einem anderen Zustand vorliegen. In diesem Diagramm berechnet die during-Aktion im Zustand PowerOn beispielsweise den Wert von airflow, wenn das Luftregelsystem eingeschaltet ist. Weitere Informationen finden Sie unter Ausführung eines Stateflow-Diagramms.
„Exit“-Aktionen
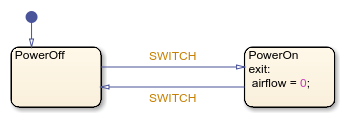
Um eine exit-Aktion hinzuzufügen, geben Sie exit oder ex ein, gefolgt von einem Doppelpunkt (:) und einem oder mehreren Ausdrücken. Das Diagramm führt diese Ausdrücke aus, wenn der Zustand aktiv ist und ein Übergang aus dem Zustand auftritt. In diesem Diagramm setzt beispielsweise die exit-Aktion im Zustand PowerOn den Wert von airflow auf null, wenn das Luftregelsystem ausgeschaltet wird. Weitere Informationen finden Sie unter Verlassen eines Zustands.
„On“-Aktionen
Um eine on-Aktion hinzuzufügen, geben Sie on ein, gefolgt vom Namen eines Ereignisses oder einer Meldung, einem Doppelpunkt (:) und einem oder mehreren Ausdrücken. Das Diagramm führt diese Ausdrücke aus, wenn der Zustand aktiv ist und das angegebene Ereignis oder die angegebene Meldung empfangen wird. Weitere Informationen finden Sie unter Synchronisieren von Modellkomponenten mithilfe von Ereignissen und Communicate with Stateflow Charts by Sending Messages.
Sie können on-Aktionen für mehrere Ereignisse oder Meldungen festlegen. Dieser Zustand umfasst beispielsweise verschiedene on-Aktionen für die Ereignisse E1 und E2.
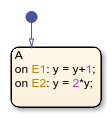
Wenn mehrere Ereignisse zugleich auftreten, werden die entsprechenden on-Aktionen in der Reihenfolge ausgeführt, in der sie in der Zustandskennzeichnung angezeigt werden. Weitere Informationen finden Sie unter Ausführung eines Stateflow-Diagramms.
Tipp
Sie können implizite Ereignisse (wie change, enter oder exit) und temporale Logik-Operatoren (wie after, at, before oder every) verwenden, um on-Aktionen in Zuständen auszulösen. Weitere Informationen finden Sie unter Kontrollieren des Diagrammverhaltens mithilfe impliziter Ereignisse und Ausführung von Steuerungsdiagrammen mithilfe der zeitlichen Logik.
„Bind“-Aktionen
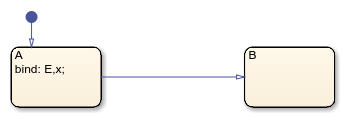
Um eine bind-Aktion hinzuzufügen, geben Sie bind ein, gefolgt von einem Doppelpunkt (:) und dem Namen eines oder mehrerer Ereignisse oder Datenobjekte. Um mehrere Ereignisse und Daten zu trennen, verwenden Sie Strichpunkte oder Kommas oder geben Sie die Ereignisse und Daten in getrennten Zeilen ein. In diesem Diagramm enthält A beispielsweise eine bind-Aktion, die das Ereignis E und das Datenobjekt x an den Zustand bindet.
Eine bind-Aktion gilt unabhängig davon, ob der Zustand aktiv oder inaktiv ist. Andere Zustände können die gebundenen Daten lesen oder gebundene Ereignisse erfassen, nur der Zustand und dessen untergeordnete Elemente können jedoch den Wert der gebundenen Daten ändern oder die gebundenen Ereignisse übertragen. Andernfalls tritt ein Kompilierfehler auf.
Wird ein Funktionsaufruf-Ereignis an einen Zustand gebunden, wird ebenso das vom Ereignis aufgerufene Funktionsaufruf-Subsystem gebunden. Das Funktionsaufruf-Subsystem wird aktiviert, wenn der bindende Zustand aktiv ist und deaktiviert, wenn der bindende Zustand nicht aktiv ist. Weitere Informationen finden Sie unter Control Function-Call Subsystems.
Wenn ein Diagramm Aktionen umfasst, die dieselben Daten oder dasselbe Ereignis an mehrere Zustände binden, tritt ein Kompilierfehler auf.
Gruppieren von Zuständen
Sie können die Bearbeitung eines Diagramms vereinfachen, indem Sie die grafischen Inhalte eines Zustands gruppieren, sodass diese als Einheit fungieren. Wenn Sie beispielsweise einen gruppierten Zustand verschieben, werden ebenfalls die Unterzustände, Übergänge und anderen grafischen Objekte in diesem Zustand verschoben. Um einen Zustand zu gruppieren, rechtsklicken Sie auf den Zustand und wählen Sie im Kontextmenü Group & Subchart > Group aus.
Sie müssen die Gruppierung eines Zustands aufheben, bevor Sie Objekte innerhalb des Zustands auswählen oder andere grafische Objekte in den Zustand verschieben. Wenn Sie beispielsweise einen Zustand oder eine grafische Funktion einen gruppierten Zustand verschieben, tritt ein invalid intersection error auf. Um die Gruppierung eines Zustands aufzuheben, rechtsklicken Sie auf den Zustand und löschen Sie im Kontextmenü Group & Subchart > Group.
Im Stateflow Editor werden gruppierte Zustände dunkler als nicht gruppierte Zustände angezeigt. In diesem Diagramm ist beispielsweise der Zustand FAN1 gruppiert, der Zustand FAN2 nicht gruppiert.
Festlegen von Eigenschaften für Zustände
Mit den unten aufgeführten Eigenschaften können Sie festlegen, wie ein Zustand mit den anderen Komponenten in Ihrem Stateflow-Diagramm interagiert. Diese Eigenschaften können Sie im Property Inspector, dem Model Explorer oder dem Zustandseigenschaften-Dialogfeld modifizieren.
Um den Property Inspector zu verwenden:
Wählen Sie auf der Registerkarte Modeling unter Design Data die Option Property Inspector aus.
Wählen Sie im Stateflow Editor den Zustand aus.
Bearbeiten Sie im Property Inspector die Zustandseigenschaften.
Um den Model Explorer zu verwenden:
Wählen Sie auf der Registerkarte Modeling unter Design Data die Option Model Explorer aus.
Wählen Sie im Fensterbereich Model Hierarchy den Zustand aus.
Bearbeiten Sie im Fensterbereich Dialog die Zustandseigenschaften.
Um das Zustandseigenschaften-Dialogfeld zu verwenden:
Rechtsklicken Sie im Stateflow Editor auf den Zustand.
Wählen Sie Properties aus.
Bearbeiten Sie im Eigenschaften-Dialogfeld die Zustandseigenschaften.
Sie können zudem Stateflow.State-Objekte verwenden, um die Zustandseigenschaften programmatisch zu modifizieren. Weitere Informationen über die Stateflow-Programmierschnittstelle finden Sie unter Overview of the Stateflow API.
Name
Name des Zustands. Diese Eigenschaft ist schreibgeschützt. Wenn Sie auf den Zustandsnamen-Hyperlink im Model Explorer und dem Zustandseigenschaften-Dialogfeld klicken, bringt der Stateflow Editor den Zustand in den Vordergrund.
Ausführungsreihenfolge
Ausführungsreihenfolge für einen parallelen (AND) Zustand. Diese Eigenschaft wird bei exklusiven (OR) Zuständen nicht angezeigt. Weitere Informationen finden Sie unter Ausführungsreihenfolge für parallele Zustände.
Erstellen eines Ausgangs zur Überwachung
Legt fest, ob ein aktiver Zustandsdaten-Ausgangsport für den Zustand erstellt werden soll. Siehe Monitor State Activity Through Active State Data.
Funktion-Inlineoption
Erscheinungsbild der Zustandsfunktionen in generiertem Code. Die Optionen umfassen:
Auto— Eine interne Berechnung legt das Erscheinungsbild der Zustandsfunktionen in generiertem Code fest.Inline— Aufrufe von Zustandsfunktionen werden durch Code ersetzt, sofern die Funktion nicht Teil einer Rekursion ist.Function— Zustandsfunktionen werden als separate statische Funktionen implementiert.
Weitere Informationen finden Sie unter Inline State Functions in Generated Code (Simulink Coder). Diese Eigenschaft ist in Property Inspector nicht verfügbar.
Kennzeichnung
Kennzeichnung für den Zustand. Weitere Informationen finden Sie unter Definieren von Aktionen in einem Zustand. Diese Eigenschaft ist in Property Inspector nicht verfügbar.
Eigenaktivität protokollieren
Legt fest, ob die Signalprotokollierung aktiviert werden soll. Die Signalprotokollierung speichert die Eigenaktivität des Zustands während der Simulation im MATLAB®-Workspace. Weitere Informationen finden Sie unter Log Simulation Output for States and Data.
Name der Protokollierung
Signalname, der zur Protokollierung der Zustandsaktivität verwendet wird.
Wählen Sie
Use state nameaus, um den Namen des Zustands zu verwenden.Um einen anderen Namen anzugeben, wählen Sie
Customaus und geben Sie den benutzerdefinierten Protokollierungsnamen ein.
Datenpunkt auf Letzten beschränken
Legt fest, ob die Anzahl protokollierter Datenpunkte auf den festgelegten Höchstwert beschränkt werden soll. Wenn Sie die Höchstanzahl an Datenpunkten auf 5000 setzen, protokolliert das Diagramm nur die letzten 5000 von der Simulation generierten Datenpunkte.
Dezimierung
Legt fest, ob der Umfang der protokollierten Daten beschränkt werden soll, indem Stichproben gemäß des angegebenen Dezimierungsintervalls übersprungen werden. Wenn Sie beispielsweise ein Dezimierungsintervall von 2 festlegen, protokolliert das Diagramm abwechselnd Proben.
Testpunkt
Legt fest, ob der Zustand als Testpunkt festgelegt werden soll, den Sie während der Simulation mit einem Floating Scope überwachen können. Zudem können Sie die Testpunkt-Werte im MATLAB-Workspace protokollieren. Weitere Informationen finden Sie unter Configure Signals as Test Points (Simulink).
Beschreibung
Beschreibung des Zustands.
Dokumentenlink
Link zur Onlinedokumentation für den Zustand. Sie können eine Web-Adresse oder einen MATLAB-Befehl eingeben, um die Dokumentation als HTML-Datei oder als Text im MATLAB-Befehlsfenster anzuzeigen. Wenn Sie auf den Hyperlink Document link klicken, evaluiert Stateflow den Link und zeigt die Dokumentation an.
Siehe auch
Objekte
Tools
- Model Explorer (Simulink)
Themen
- Verwenden der Zustandshierarchie zur Gestaltung einer mehrschichtigen Zustandskomplexität
- Definieren exklusiver und paralleler Modi durch Verwendung von Zustandsdekomposition
- Ausführung eines Stateflow-Diagramms
- Beseitigen von überflüssigem Code durch Kombinieren von Zustandsaktionen
- Control Function-Call Subsystems