Kontrollieren des Diagrammverhaltens mithilfe impliziter Ereignisse
Implizite Ereignisse sind integrierte Ereignisse, die während der Ausführung des Diagramms auftreten, wenn:
Das Diagramm wird aktiviert.
Das Diagramm wechselt in einen Zustand und der Zustand wird aktiv.
Das Diagramm verlässt einen Zustand und der Zustand wird inaktiv.
Das Diagramm weist einem internen Datenobjekt einen Wert zu.
Diese Ereignisse sind implizit, weil Sie sie nicht explizit definieren oder auslösen. Implizite Ereignisse sind untergeordnete Elemente des Diagramms, in dem sie auftreten, und sind nur im übergeordneten Diagramm sichtbar.
Auf der Diagrammausführung basierende implizite Ereignisse
Das Schlüsselwort tick gibt das implizite Ereignis an, das generiert wird, wenn ein Diagramm in einer zeitdiskreten Simulation aktiviert wird.
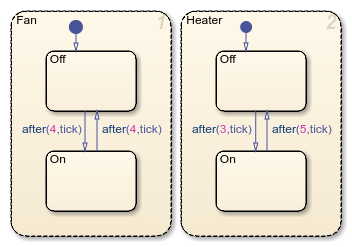
In diesem Diagramm sind beispielsweise Fan und Heater parallele (UND-)Zustände. Jeder Zustand hat ein Paar Teilzustände, On und Off. Zunächst sind die Teilzustände Fan.Off und Heater.Off aktiv. Jedes Mal, wenn das Diagramm aktiviert wird, wird ein tick-Ereignis generiert. Das dritte tick löst den Übergang von Heater.Off zu Heater.On aus. Ebenso löst das vierte tick den Übergang von Fan.Off zu Fan.On aus. Beim achten tick wechselt das Diagramm wieder zu Fan.Off und Heater.Off.
Informationen über den temporalen Logikoperator after finden Sie unter Ausführung von Steuerungsdiagrammen mithilfe der zeitlichen Logik.
Hinweis
Das Ereignis tick bezieht sich auf das Diagramm, das die zu evaluierende Aktion enthält. Das Ereignis kann sich nicht auf ein anderes Diagramm beziehen.
Auf Daten und Zuständen basierende implizite Ereignisse
In Stateflow®-Diagrammen in Simulink®-Modellen erzeugen diese Operatoren implizite Ereignisse, wenn ein Diagramm den Wert einer Variablen festlegt oder wenn ein Diagramm in einen Zustand eintritt oder diesen verlässt.
| Operator | Syntax | Beschreibung | Beispiel |
|---|---|---|---|
change |
| Erzeugt ein implizites lokales Ereignis, wenn das Diagramm den Wert der Variablen data_name festlegt. | Definieren Sie ein implizites lokales Ereignis, wenn eine Zustands- oder Übergangsaktion einen Wert in die Variable change(Engine.rpm) |
enter |
| Erzeugt ein implizites lokales Ereignis, wenn der angegebene Zustand state_name aktiv wird. | Definieren eines impliziten lokalen Ereignisses, wenn die Diagrammausführung in den Zustand enter(Fan.On) |
exit |
| Erzeugt ein implizites lokales Ereignis, wenn der angegebene Zustand state_name inaktiv wird. | Definiert ein implizites lokales Ereignis, wenn die Diagrammausführung den Zustand exit(Fan.Off) |
Wenn mehr als ein Zustand oder Datenobjekt denselben Namen hat, qualifizieren Sie mit der Punktnotation den Namen des Zustands. Weitere Informationen finden Sie unter Identify Data by Using Dot Notation.
In diesem Diagramm sind beispielsweise Fan und Heater parallele (UND-)Zustände. Jeder Zustand hat ein Paar Teilzustände, On und Off. Zunächst sind die Teilzustände Fan.Off und Heater.Off aktiv. Wenn das Diagramm aktiviert wird, generiert es ein tick-Ereignis, das den Übergang von Fan.Off zu Fan.On auslöst. Wenn Fan.Off inaktiv wird, generiert das Diagramm ein weiteres implizites Ereignis, das den Übergang von Heater.Off zu Heater.On auslöst. Wenn die Ausführung des Diagramms endet, sind die Teilzustände Fan.On und Heater.On aktiv.

Hinweis
Wenn dasselbe implizite Ereignis mehrere Übergänge in parallelen Zuständen auslöst, entspricht die Reihenfolge, in der die Übergänge ausgeführt werden, nicht unbedingt der Ausführungsreihenfolge der parallelen Zustände. Um unerwartetes Verhalten zu vermeiden und sicherzustellen, dass die Übergänge in der für die parallelen Zustände angegebenen Reihenfolge ausgeführt werden, verwenden Sie keine impliziten Ereignisse. Verwenden Sie stattdessen Übergangsbedingungen, die Operatoren wie in oder hasChanged aufrufen. Weitere Informationen finden Sie unter Check State Activity by Using the in Operator und Detect Changes in Data and Expression Values.
Siehe auch
after | change | enter | exit | hasChanged | in