Latest Contributions
- @Sam Chak earned the Most Accepted Answers Badge for both 2024 and 2025. Sam is a rising star in MATLAB Answers with 2,000+ answers and 1,000+ votes.
- @Rodney Tan has been actively contributing files to File Exchange. In 2025, his submissions got almost 20,000 downloads!
- @Dyuman Joshi was recognized as a top contributor on both Cody and Answers. Many may not know that Dyuman is also a Cody moderator, doing tremendous behind-the-scenes moderation work to keep the platform running smoothly.
- A warm welcome to @Steve Eddins, who joined the Community Advisory Board. Steve brings a unique perspective as a former MathWorker and long-time top community contributor.
- Congratulations to @Walter Roberson on reaching 100 followers! MATLAB Central thrives on people-to-people connections, and we’d love to see even more of these relationships grow.
- Zoomed Axes, submitted by @Caleb Thomas, enables zoomed-in views of selected regions in a plot.This submission was featured in the Pick of the Week blog post, “MATLAB Zoomed Axes: Showing zoomed-in regions of a 2D plot,” which generated 5,000 views in just one month.
- What did MATLAB/Simulink users wait for most in 2025? It's R2025a! “Where is MATLAB R2025a?” became the most-viewed discussion post, with 10,000 views and 30 comments. Thanks for your patience — MATLAB R2025a turned out to be one of the biggest releases we’ve ever delivered.
- “How do I create a for loop in MATLAB?” was the most-viewed community question of the year. It’s a fun reminder that even as MATLAB evolves, the basics remain essential — and always in demand.
- “Did you know there is an official MATLAB certification?”, created by @goc3, was the most-voted poll of 2025.While 50% of respondents voted “No”, it’s exciting to see 3% are certified MATLAB Professionals. Will you be one of them in 2026?
- 20,000+ solutions were submitted
- 20+ tips & tricks articles were shared by top players
- Join a team that matches your coding personality
- Solve Cody problems, complete the contest problem group, or share Tips & Tricks articles
- Bonus Round: Two top players from each team will be invited to a fun code-along event
- Main Round: Nov 10 – Dec 7, 2025
- Bonus Round: Dec 8 – Dec 19, 2025
- (New prize) Solving just one problem in the contest problem group gives you a chance to win MathWorks T-shirts or socks each week.
- Finishing the entire problem group will greatly increase your chances—while helping your team win.
- Share high-quality Tips & Tricks articles to earn you a coveted MathWorks Yeti Bottle.
- Become a top finisher in your team to win Amazon gift cards and an invitation to the bonus round.
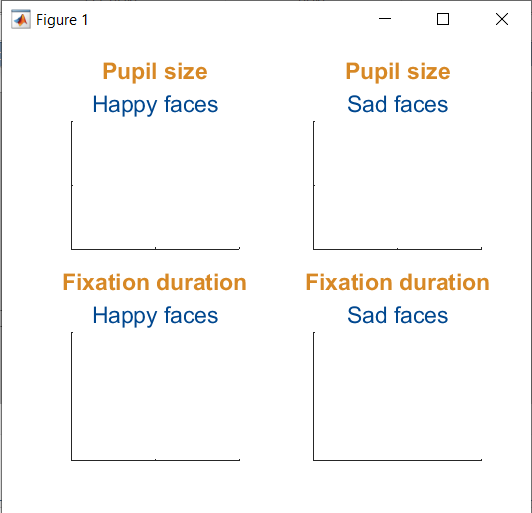
Add a subtitle
Multi-lined titles have been supported for a long time but starting in r2020b, you can add a subtitle with its own independent properties to a plot in two easy ways.
- Use the new subtitle function: s=subtitle('mySubtitle')
- Use the new second argument to the title function: [t,s]=title('myTitle','mySubtitle')
figure()
tiledlayout(2,2)
% Method 1
ax(1) = nexttile;
th(1) = title('Pupil size');
sh(1) = subtitle('Happy faces');
ax(2) = nexttile;
th(2) = title('Pupil size');
sh(2) = subtitle('Sad faces');
% Method 2
ax(3) = nexttile;
[th(3), sh(3)] = title('Fixation duration', 'Happy faces');
ax(4) = nexttile;
[th(4), sh(4)] = title('Fixation duration', 'Sad faces');
set(ax, 'xticklabel', [], 'yticklabel', [],'xlim',[0,1],'ylim',[0,1])
% Set all title colors to orange and subtitles colors to purple.
set(th, 'Color', [0.84314, 0.53333, 0.1451])
set(sh, 'Color', [0, 0.27843, 0.56078])
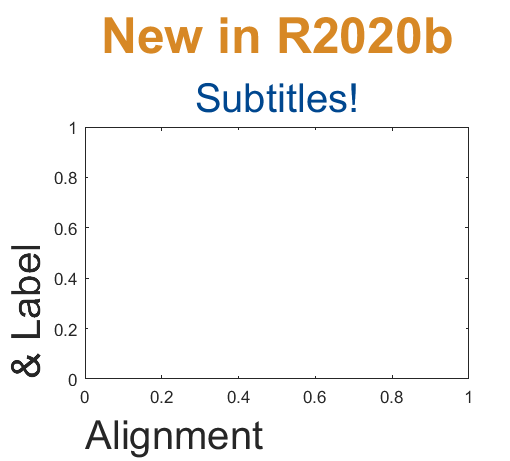
Control title/Label alignment
Title and axis label positions can be changed via their Position, VerticalAlignment and HorizontalAlignment properties but this is usually clumsy and leads to other problems when trying to align the title or labels with an axis edge. For example, when the position units are set to 'data' and the axis limits change, the corresponding axis label will change position relative to the axis edges. If units are normalized and the axis position or size changes, the corresponding label will no longer maintain its relative position to the axis, and that's assuming the normalized position was computed correctly in the first place.
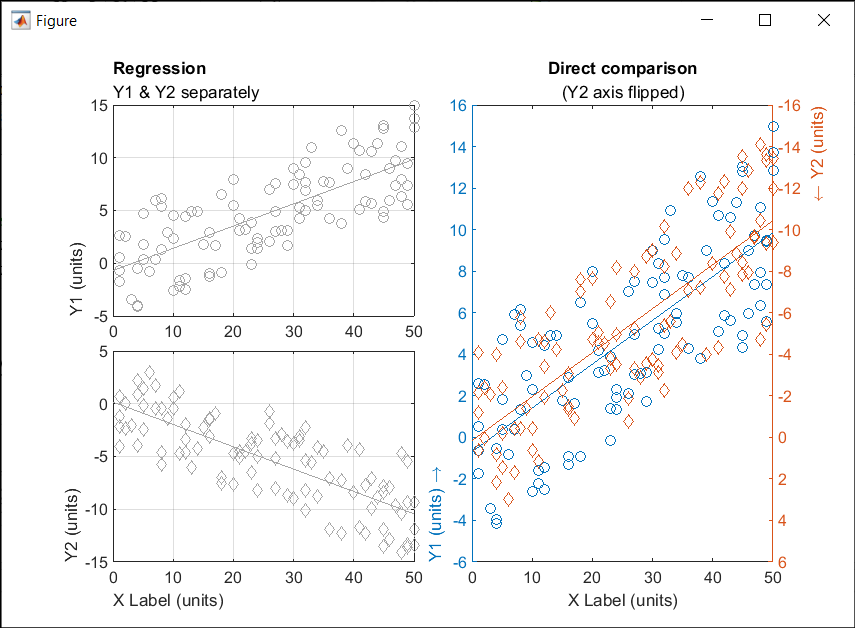
Starting in r2020b, title and axis label alignment can be set to center|left|right, relative to the axis edges.
- TitleHorizontalAlignment is a property of the axis: h.TitleHorizontalAlignment='left';
- LabelHorizontalAlignment is a property of the ruler object that defines the x | y | z axis: h.XAxis.LabelHorizontalAlignment='left';
% Create data
x = randi(50,1,100)';
y = x.*[.2, -.2] + (rand(numel(x),2)-.5)*10;
gray = [.65 .65 .65];
% Plot comparison between columns of y
figure()
tiledlayout(2,2,'TileSpacing','none')
ax(1) = nexttile(1);
plot(x, y(:,1), 'o', 'color', gray)
lsline
ylabel('Y1 (units)')
title('Regression','Y1 & Y2 separately')
ax(2) = nexttile(3);
plot(x, y(:,2), 'd', 'color', gray)
lsline
xlabel('X Label (units)')
ylabel('Y2 (units)')
grid(ax, 'on')
linkaxes(ax, 'x')
%  Move title and labels leftward
set(ax, 'TitleHorizontalAlignment', 'left')
set([ax.XAxis], 'LabelHorizontalAlignment', 'left')
set([ax.YAxis], 'LabelHorizontalAlignment', 'left')
% Combine the two comparisons into plot and flip the second
% y-axis so trend are in the same direction
ax(3) = nexttile([2,1]);
yyaxis('left')
plot(x, y(:,1), 'o')
ylim([-6,16])
lsline
xlabel('X Label (units)')
ylabel('Y1 (units) \rightarrow')
yyaxis('right')
plot(x, y(:,2), 'd')
ylim([-16,6])
lsline
ylabel('\leftarrow Y2 (units)')
title('Direct comparison','(Y2 axis flipped)')
set(ax(3),  'YDir','Reverse')
% Align the ylabels with the minimum axis limit to emphasize the
% directions of each axis. Keep the title and xlabel centered
ax(3).YAxis(1).LabelHorizontalAlignment = 'left';
ax(3).YAxis(2).LabelHorizontalAlignment = 'right';
ax(3).TitleHorizontalAlignment = 'Center';       % not needed; default value.
ax(3).XAxis.LabelHorizontalAlignment = 'Center'; % not needed; default value.
Starting in MATLAB R2022a, use the append option in exportgraphics to create GIF files from animated axes, figures, or other visualizations.
This basic template contains just two steps:
% 1. Create the initial image file
gifFile = 'myAnimation.gif';
exportgraphics(obj, gifFile);
% 2. Within a loop, append the gif image
for i = 1:20
      %   %   %   %   %   %    %
      % Update the figure/axes %
      %   %   %   %   %   %    %
exportgraphics(obj, gifFile, Append=true); end
Note, exportgraphics will not capture UI components such as buttons and knobs and requires constant axis limits.
To create animations of images or more elaborate graphics, learn how to use imwrite to create animated GIFs .
Share your MATLAB animated GIFs in the comments below!
See Also
This Community Highlight is attached as a live script
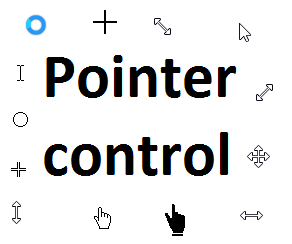
Starting in r2020a , you can change the mouse pointer symbol in apps and uifigures.
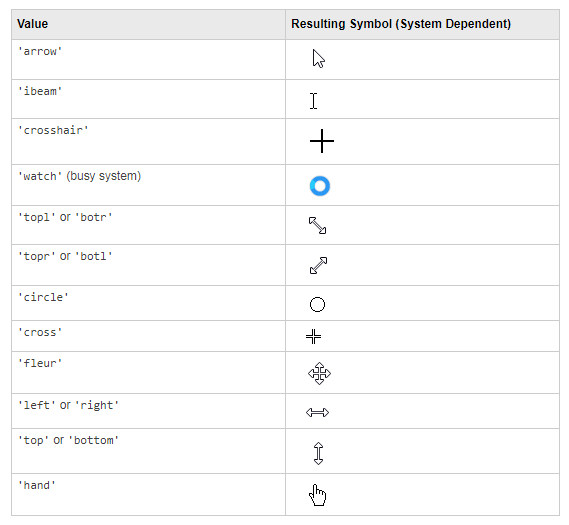
The Pointer property of a figure defines the cursor’s default pointer symbol within the figure. You can also create your own pointer symbols (see part 3, below).
Part 1. How to define a default pointer symbol for a uifigure or app
For figures or uifigures, set the pointer property when you define the figure or change the pointer property using the figure handle.
% Set pointer when creating the figure
uifig = uifigure('Pointer', 'crosshair');
% Change pointer after creating the figure
uifig.Pointer = 'crosshair';
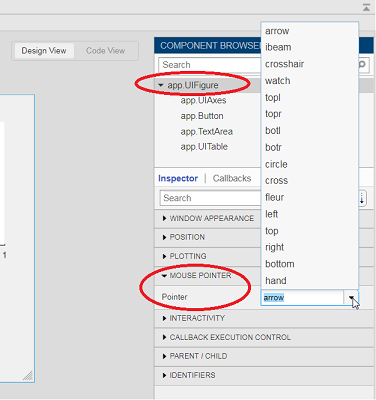
For apps made in AppDesigner, you can either set the pointer from the Design View or you can set the pointer property of the app’s UIFigure from the startup function using the second syntax shown above.
Part 2. How to change the pointer symbol dynamically
The pointer can be changed by setting specific conditions that trigger a change in the pointer symbol.
For example, the pointer can be temporarily changed to a busy-symbol when a button is pressed. This ButtonPushed callback function changes the pointer for 1 second.
function WaitasecondButtonPushed(app, event)
   % Change pointer for 1 second.
   set(app.UIFigure, 'Pointer','watch')
   pause(1)
   % Change back to default.
   set(app.UIFigure, 'Pointer','arrow')
   app.WaitasecondButton.Value = false;
end
The pointer can be changed every time it enters or leaves a uiaxes or any plotted object within the uiaxes. This is controlled by a set of pointer management functions that can be set in the app’s startup function.
iptSetPointerBehavior(obj,pointerBehavior) allows you to define what happens when the pointer enters, leaves, or moves within an object. Currently, only axes and axes objects seem to be supported for UIFigures.
iptPointerManager(hFigure,'enable') enables the figure’s pointer manager and updates it to recognize the newly added pointer behaviors.
The snippet below can be placed in the app’s startup function to change the pointer to crosshairs when the pointer enters the outerposition of a uiaxes and then change it back to the default arrow when it leaves the uiaxes.
% Define pointer behavior when pointer enter axes
pm.enterFcn = @(~,~) set(app.UIFigure, 'Pointer', 'crosshair');
pm.exitFcn  = @(~,~) set(app.UIFigure, 'Pointer', 'arrow');
pm.traverseFcn = [];
iptSetPointerBehavior(app.UIAxes, pm)
% Enable pointer manager for app
iptPointerManager(app.UIFigure,'enable');
Any function can be triggered when entering/exiting an axes object which makes the pointer management tools quite powerful. This snippet below defines a custom function cursorPositionFeedback() that responds to the pointer entering/exiting a patch object plotted within the uiaxes. When the pointer enters the patch, the patch color is changed to red, the pointer is changed to double arrows, and text appears in the app’s text area. When the pointer exits, the patch color changes back to blue, the pointer changes back to crosshairs, and the text area is cleared.
% Plot patch on uiaxes
hold(app.UIAxes, 'on')
region1 = patch(app.UIAxes,[1.5 3.5 3.5 1.5],[0 0 5 5],'b','FaceAlpha',0.07,...
    'LineWidth',2,'LineStyle','--','tag','region1');
% Define pointer behavior for patch
pm.enterFcn = @(~,~) cursorPositionFeedback(app, region1, 'in');
pm.exitFcn  = @(~,~) cursorPositionFeedback(app, region1, 'out');
pm.traverseFcn = [];
iptSetPointerBehavior(region1, pm)
% Enable pointer manager for app
iptPointerManager(app.UIFigure,'enable');
function cursorPositionFeedback(app, hobj, inout)
% When inout is 'in', change hobj facecolor to red and update textbox.
% When inout is 'out' change hobj facecolor to blue, and clear textbox.
% Check tag property of hobj to identify the object.
switch lower(inout)
    case 'in'
        facecolor = 'r';
        txt = 'Inside region 1';
        pointer = 'fleur';
    case 'out'
        facecolor = 'b';
        txt = '';
        pointer = 'crosshair';
end
hobj.FaceColor = facecolor;
app.TextArea.Value = txt;
set(app.UIFigure, 'Pointer', pointer)
end
The app showing the demo below is attached.
Part 3. Create your own custom pointer symbol
- Set the figure’s pointer property to ‘custom’.
- Set the figure’s PointerShapeCData property to the custom pointer matrix. A custom pointer is defined by a 16x16 or 32x32 matrix where NaN values are transparent, 1=black, and 2=white.
- Set the figure’s PointerShapeHotSpot to [m,n] where m and n are the coordinates that define the tip or "hotspot" of the matrix.
This demo uses the attached mat file to create a black hand pointer symbol.
iconData = load('blackHandPointer.mat');
uifig = uifigure();
uifig.Pointer = 'custom';
uifig.PointerShapeCData = iconData.blackHandIcon;
uifig.PointerShapeHotSpot = iconData.hotspot;
Also see Jiro's pointereditor() function on the file exchange which allows you to draw your own pointer.
- Date: April 29, 2025
- Location: St. John’s Resort, Plymouth, MI
- Virtual Development
- Electrification
- Software Development
- AI in Engineering
- Allow MathWorks and the community leaders to easily post newsworthy items to the community
- Allow community visitors to respond to these posts with Likes and Replies
- Allow anyone to follow/subscribe the channel so they can be notified of new posts
- New or upcoming community features or events
- User highlights (e.g. examples of good behavior, interesting posts)
- Interesting content (e.g. File Exchange pick of the week submissions)
- Release notes and new features
- Polls (future)
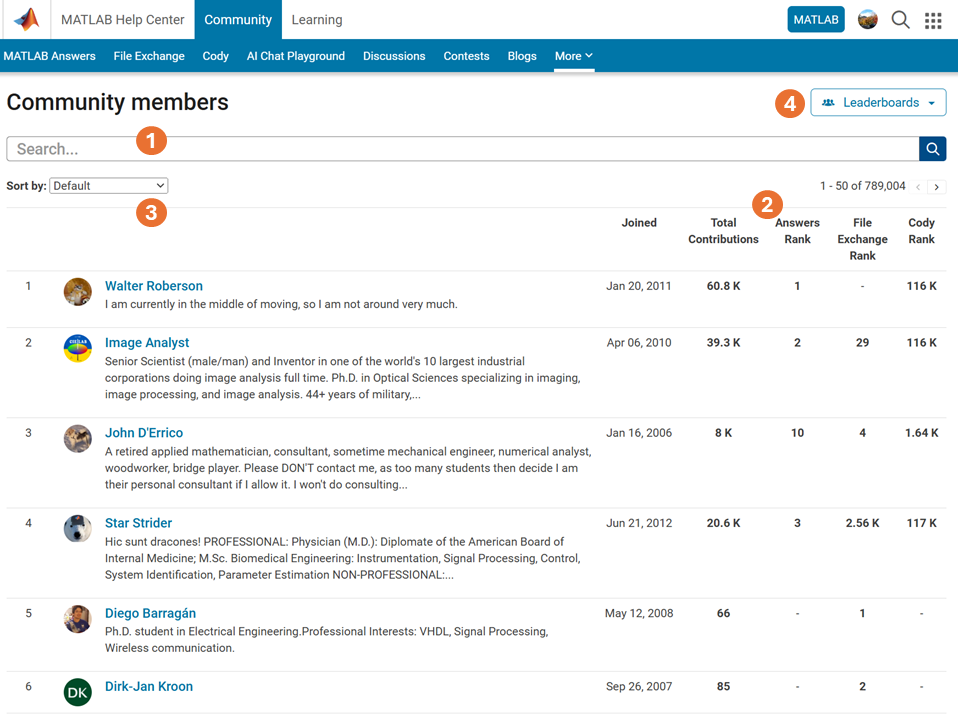
- Comprehensive User Search: Search for users across different applications seamlessly.
- Detailed User Information: View a list of community members along with additional details such as their join date, rankings, and total contributions.
- Sorting Options: Use the ‘sort by’ filter located below the search bar to organize the list according to your preferences.
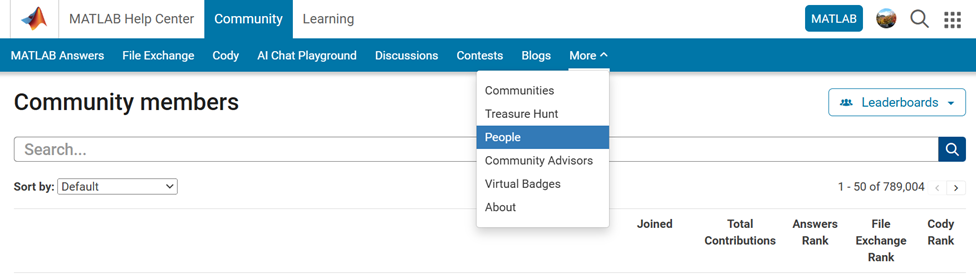
- Easy Navigation: Access the Answers, File Exchange, and Cody Leaderboard by clicking the ‘Leaderboards’ button in the upper right corner.


Info zu Highlights
View announcements and updates in the MATLAB and Simulink product community, including MATLAB Central and Discussions.Share your feedback and join the conversation by participating in polls posted by staff and community power users. These polls appear across MathWorks.com, so look for them while signed in to community pages.