Model Finite State Machines Using State Transition Tables
You can use the State Transition Table block to model a finite state machine for sequential modal logic. Compared to a Stateflow® chart, a state transition table requires minimal maintenance of graphical objects when you add or modify the top-level Simulink model.
Program a State Transition Table
In a state transition table, rows represent the states in your system. The transition columns specify the conditions, condition actions, and destination states for each outgoing transition from a state. The IF column represents the primary transitions for your model, and the ELSE-IF column contains the actions that the model takes if the primary transition is not valid. You can also add in extra columns by using the Append transition column and Insert transition column options.
Each column cell is subdivided into three rows. The first row is the condition cell, the second row is the condition action cell, and the third row is the destination state cell. For more information about conditions and condition actions, see Define Actions in a Transition.

For example, this state transition table contains the modal logic that maintains
the temperature of a boiler between two set points, reference_low
and reference_high. During normal operation, the boiler cycles
between the states Off, Warmup, and
On.

The state transition table represents the same modal logic as this Stateflow chart.

For more information about this example, see Model Bang-Bang Controller by Using a State Transition Table.
Create a State Transition Table
To create a state transition table:
Start MATLAB®. In the MATLAB Toolstrip, in the Home tab, click Simulink.
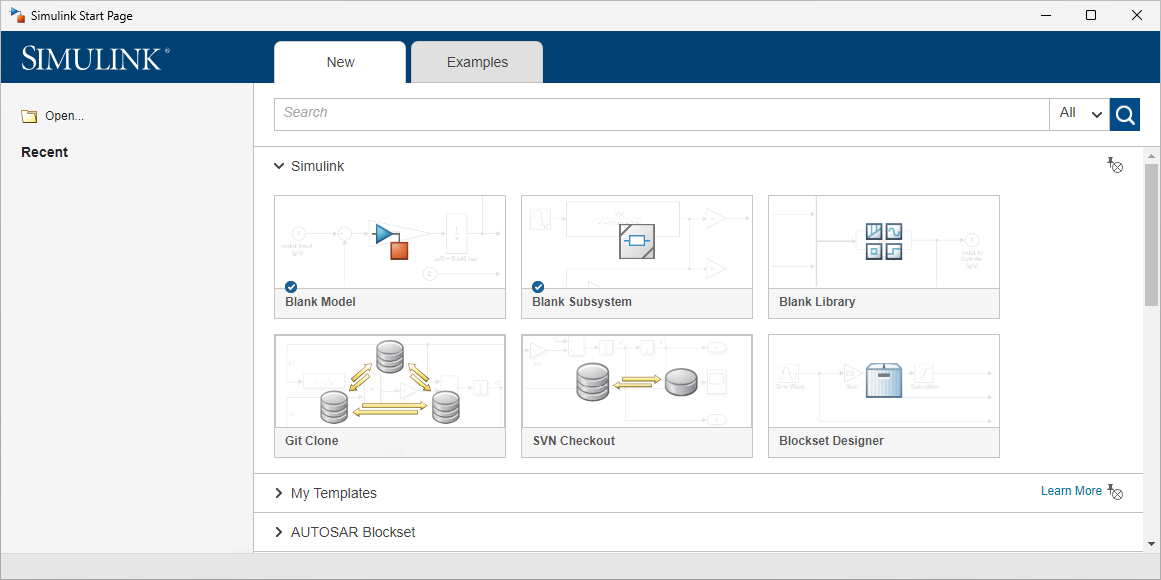
On the start page, in the Simulink section, click the Blank Model template. Simulink® opens and displays an empty model.
In the model, add a State Transition Table block.
Double-click to enter the State Transition Table block.
For each operating mode in your system, add a state row. Select an existing state and, in the Modeling tab, choose from one of these options:
Insert State Row — Add a state at the same level of hierarchy.
Insert Child State Row — Add a state as a child of the selected state.
Note
To move a state row, click the top edge of the state and drag the state to a new location. As you drag the state, the editor displays a graphical cue that indicates the new position of the state.
To model operating modes that are active at the same time, enable parallel (AND) decomposition in a parent state. For more information, see Simulate Parallel States with a State Transition Table.
Add a state label for each state, as described in Define Actions in a State.
To represent the direction of flow logic between states, specify the conditions, condition actions, and destinations for the outgoing transitions from each state.
To add a transition column, right-click the header for an existing column and choose from one of these options:
Append transition column — Add a transition column to the right of the table.
Insert transition column — Add a transition column to the left of the selected column.
To move the condition, action, and destination cells for a transition, click the top edge of the condition cell and drag the transition left or right. The condition, action, and destination cells move together.
To specify the destination of the transition, in the destination state cell, select the name of a state or one of these options:
$NEXT— Create a transition to the next sibling state. This option is not available for the last substate in each level of the state hierarchy.$PREV— Create a transition to the previous sibling state. This option is not available for the first substate in each level of the state hierarchy.$SELF— Create a self-loop transition.
To comment out a transition, in the destination state cell, select
% IGNORE %.
Manage Sibling and Child States in a State Transition Table
If your state transition table includes multiple sibling states, mark which sibling state should become active first when its parent becomes active. Select a state and, in the Modeling tab, select Set as Default State.
Alternatively, to specify a default transition path with multiple branching
points, in the Modeling tab, select Insert Default
Transition Row. For example, this default transition row selects
between two destinations, A1 and A2, depending
on the value of condition.
The icon on this state shows the default transition with multiple branching points.
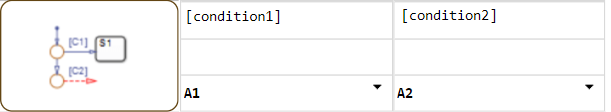
To specify an inner transition from the a parent state to one or more child
states, in the Modeling tab, select Insert Inner
Transition Row. For example, in this inner transition row, the input
event E triggers an inner transition that selects between two
destinations, B1 and B2, depending on the
values of condition1 and condition2.

The icon on this state shows the inner transition with multiple branching points.
You must specify destination states in an inner transition row in the same order
that the corresponding child states appear in the table. For instance, in the
previous example, state B1 must appear above state
B2.
Connect the State Transition Table block to other blocks in the Simulink model by using input and output ports.
Simulate Parallel States with a State Transition Table
In Stateflow, you use parallel decomposition to enable two states to be active
simultaneously. For example, if State A uses parallel decomposition and has two
substates, A1 and A2, both
A1 and A2 are active at the same time. For
more information on parallel states, see Define Exclusive and Parallel Modes by Using State Decomposition.
To use parallel states in State Transition Table blocks, enter the state transition table. To change the decomposition at the chart level, do not select a state, and in the Modeling tab, select Decomposition > Parallel (AND). To give a state parallel decomposition, select a state, and in the Modeling tab, select Decomposition > Parallel (AND).
Note
Before updating the decomposition of your chart or state to Parallel (AND), you must clear all cells in the transition column of the state.
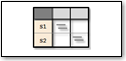
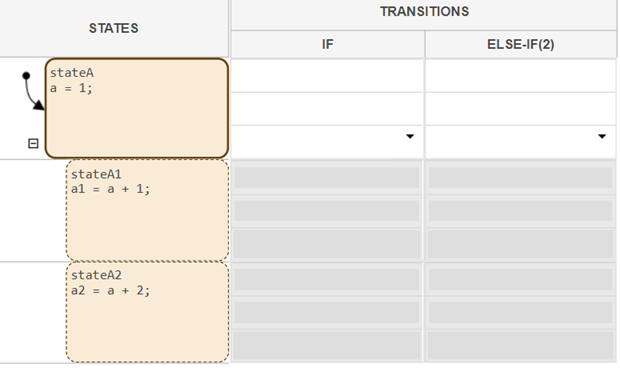
Parallel states have a dashed outline. In this state transition table,
stateA has parallel decomposition, so its child states
stateA1 and stateA2 appear with dashed
lines and are active simultaneously.
Detect Errors in State Transition Tables
To detect syntax errors in a state transition table, compile the model. In the Debug tab, select Update Model. When you compile the model, it statically parses the table to find errors such as:
Unresolved symbols
Unreachable states
Default transition rows without an unconditional transition
Transition cells with conditions or actions, but no destination
Action text in a condition cell
Inner transition rows that specify destination states in a different order than the corresponding states appear in the table
These error checks are also performed during simulation. For more information about debugging state transition tables, see Enable Logging and Breakpoints in State Transition Tables.
Guidelines for Using State Transition Tables
State transition tables can use MATLAB or C as the action language. For more information, see Differences Between MATLAB and C as Action Language Syntax.
State transition tables must have at least one state row and one transition column.
State transition tables do not support these elements of Stateflow charts:
Supertransitions
Local events
Chart-level graphical, truth table, MATLAB, and Simulink functions