convertToChart
Beschreibung
Beispiele
Dieses Beispiel veranschaulicht, wie Sie eine Zustandsübergangstabelle in ein Stateflow®-Diagramm umwandeln.
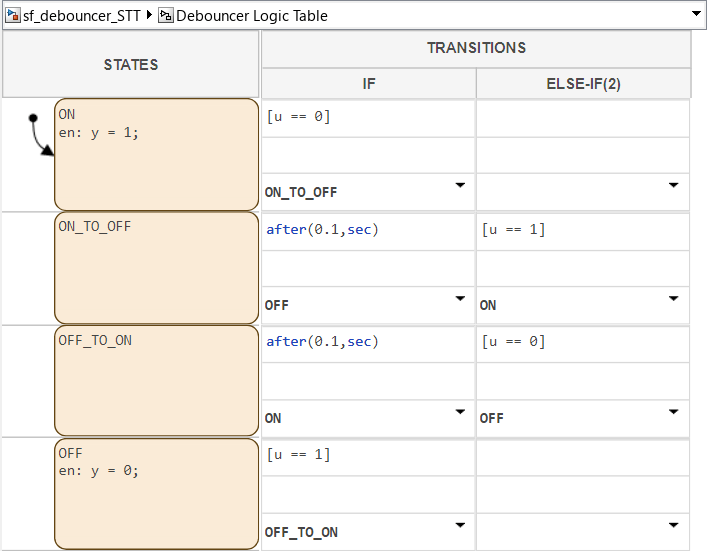
Öffnen Sie das Beispielmodell und greifen Sie auf das Stateflow.StateTransitionTableChart-Objekt zu.
open_system("sf_debouncer_STT")
table = find(sfroot,"-isa","Stateflow.StateTransitionTableChart");
view(table)
Wandeln Sie die Zustandsübergangstabelle in ein Stateflow-Diagramm um.
chart = convertToChart(table);
view(chart)

Eingabeargumente
Versionsverlauf
Eingeführt in R2023b