State Transition Table
Darstellen modaler Logik in tabellarischer Form
Bibliotheken:
Stateflow
Beschreibung
Der State Transition Table-Block stellt eine endliche Zustandsmaschine in tabellarischer Form dar. Statt Zustände und Übergänge in einem Stateflow®-Diagramm darzustellen, können Sie mit einer Zustandsübergangstabelle eine Zustandsmaschine in einem kompakten Format darstellen, das nur eine minimale Nutzung grafischer Objekte erfordert. Weitere Informationen finden Sie unter Model Finite State Machines Using State Transition Tables.
Zum Implementieren einer Steuerlogik können State Transition Table-Blöcke MATLAB® oder C als Aktionssprache verwenden. Weitere Informationen finden Sie unter Unterschiede zwischen MATLAB und C als Aktionssprache-Syntax.
Beispiele
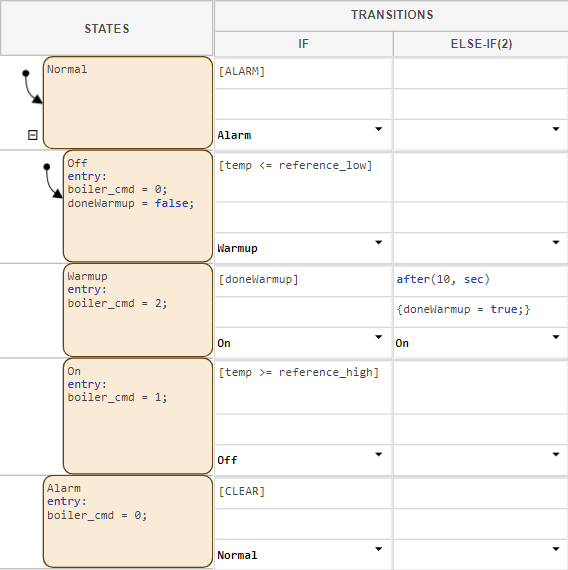
Model Bang-Bang Controller by Using a State Transition Table
Use a state transition table to model a temperature regulator.
Ports
Eingang
Ausgang
Parameter
Verwenden Sie Property Inspector, um Blockparameter interaktiv zu bearbeiten. Wählen Sie in der Simulink®-Werkzeugleiste auf der Registerkarte Simulation aus der Galerie Prepare Property Inspector aus.
Hinweis
State Transition Table-Blöcke weisen zudem Subsystem (Simulink)-Blockparameter auf, auf die Sie über Rechtsklick auf den Block und Klick auf die Schaltfläche „Block Parameters“  zugreifen können. Eine Änderung dieser Blockparameter wird jedoch nicht empfohlen.
Methoden zur Aktualisierung oder zum Aufwecken von Stateflow-Zustandsübergangstabelle, angegeben als Inherited, Discrete oder Continuous.
InheritedDer Eingang vom Simulink-Modell legt fest, wann die Zustandsübergangstabelle während einer Simulation aufgeweckt wird.
Wenn Sie Eingangsereignisse für die Zustandsübergangstabelle definieren, löst das Signal vom mit dem Auslöser-Port verbundenen Simulink-Block die Zustandsübergangstabelle aus. Das Simulink-Signal kann
Rising,FallingoderEither(ansteigend oder fallend) sein oder als Antwort auf einenFunction Callübermittelt werden. Weitere Informationen finden Sie unter Aktivieren von Stateflow-Diagrammen durch Absenden von Eingangsereignissen.Wenn Sie keine Eingangsereignisse definieren, erbt die Stateflow-Zustandsübergangstabelle implizit Auslöser vom Simulink-Modell. Diese impliziten Ereignisse sind die diskreten oder kontinuierlichen Abtastzeiten der Simulink-Signale, die Eingänge für die Zustandsübergangstabelle bereitstellen. Wenn Sie Dateneingänge definieren, wird die Zustandsübergangstabelle mit der Rate des schnellsten Dateneingangs aufgeweckt. Wenn Sie keine Dateneingänge für die Zustandsübergangstabelle definieren, wird die Zustandsübergangstabelle wie vom Ausführungsverhalten des übergeordneten Subsystems festgelegt aufgeweckt.
DiscreteDie Stateflow-Zustandsübergangstabelle wird aufgeweckt, wenn das Simulink-Modell in regelmäßigen Zeitabständen, die Sie in der Zustandsübergangstabellen-Eigenschaft Sample Time festlegen, ein implizites Ereignis generiert. Andere Blöcke im Simulink-Modell können andere Abtastzeiten aufweisen.
ContinuousDie Stateflow-Zustandsübergangstabelle aktualisiert ihren Zustand nur bei größeren Zeitschritten und berechnet Ausgänge und lokale kontinuierliche Variablen bei größeren und kleineren Zeitschritten. Die Zustandsübergangstabelle kann Nullübergänge registrieren, was es Simulink-Modellen erlaubt, Stateflow-Zustandsübergangstabellen abzutasten, wenn eine Zustandsänderung auftritt. Die Stateflow-Zustandsübergangstabelle berechnet Ableitungen der lokalen kontinuierlichen Variablen. Weitere Informationen finden Sie unter Continuous-Time Modeling in Stateflow.
Programmatische Verwendung
Um den Block-Parameterwert programmatisch festzulegen, greifen Sie auf das Stateflow.StateTransitionTableChart-Objekt des Blocks zu und ändern Sie die Objekteigenschaft mithilfe der Punktschreibweise.
| Parameter: | ChartUpdate |
| Werte: | "INHERITED" (Standardeinstellung) | "CONTINUOUS" | "DISCRETE" |
Das Standard-Zeitintervall ist -1; dies weist darauf hin, dass die Stateflow-Zustandsübergangstabelle die Abtastzeit von Simulink erbt.
Legen Sie das Zeitintervall fest, nach dem die Zustandsübergangstabelle während der Simulation aufgeweckt wird. Der Standardwert gibt an, dass die Zustandsübergangstabelle die Abtastzeit von Simulink erbt. Weitere Informationen zum Festlegen der Abtastzeit finden Sie unter Festlegen der Abtastzeit (Simulink).
Verwenden Sie nicht den Parameter Sample Time der Subsystem-Blockparameter. Verwenden Sie stattdessen den Property Inspector.
Abhängigkeiten
Um diesen Parameter zu aktivieren, setzen Sie Update Method auf Discrete.
Programmatische Verwendung
Um den Block-Parameterwert programmatisch festzulegen, greifen Sie auf das Stateflow.StateTransitionTableChart-Objekt des Blocks zu und ändern Sie die Objekteigenschaft mithilfe der Punktschreibweise.
| Parameter: | SampleTime |
| Werte: | "-1" (Standardeinstellung) | string scalar | character vector |
| Datentypen: | string | char |
Legt fest, ob ein aktiver Zustandsdaten-Ausgangsport für die Zustandsübergangstabelle erstellt werden soll. Weitere Informationen finden Sie unter Monitor State Activity Through Active State Data.
Programmatische Verwendung
Um den Block-Parameterwert programmatisch festzulegen, greifen Sie auf das Stateflow.StateTransitionTableChart-Objekt des Blocks zu und ändern Sie die Objekteigenschaft mithilfe der Punktschreibweise.
| Parameter: | HasOutputData |
| Werte: | false or 0 (Standardeinstellung) | true or 1 |
| Datentypen: | logical |
Überwachungsmodus für die Ausgabedaten aktiver Zustände.
Abhängigkeiten
Um diesen Parameter zu aktivieren, aktivieren Sie Create output for monitoring.
Programmatische Verwendung
Um den Block-Parameterwert programmatisch festzulegen, greifen Sie auf das Stateflow.StateTransitionTableChart-Objekt des Blocks zu und ändern Sie die Objekteigenschaft mithilfe der Punktschreibweise.
| Parameter: | OutputMonitoringMode |
| Werte: | "ChildActivity" (Standardeinstellung) | "LeafStateActivity" |
Name des Datenobjekts des aktiven Zustands für die Zustandsübergangstabelle.
Abhängigkeiten
Um diesen Parameter zu aktivieren, aktivieren Sie Create output for monitoring.
Programmatische Verwendung
Um den Block-Parameterwert programmatisch festzulegen, greifen Sie auf das Stateflow.StateTransitionTableChart-Objekt des Blocks zu und ändern Sie die Objekteigenschaft mithilfe der Punktschreibweise.
| Parameter: | OutputPortName |
| Werte: | "State_Transition_TableMode" (Standardeinstellung) | string scalar | character vector |
| Datentypen: | string | char |
Name des Datenobjekts des aktiven Zustands für die Zustandsübergangstabelle.
Abhängigkeiten
Um diesen Parameter zu aktivieren, aktivieren Sie Create output for monitoring.
Programmatische Verwendung
Um den Block-Parameterwert programmatisch festzulegen, greifen Sie auf das Stateflow.StateTransitionTableChart-Objekt des Blocks zu und ändern Sie die Objekteigenschaft mithilfe der Punktschreibweise.
| Parameter: | EnumTypeName |
| Werte: | "State_Transition_TableModeType" (Standardeinstellung) | string scalar | character vector |
| Datentypen: | string | char |
Ob der Aufzählungsdatentyp für die aktive Zustandsdatenausgabe manuell definiert werden soll. Weitere Informationen finden Sie unter Define State Activity Enumeration Type.
Abhängigkeiten
Um diesen Parameter zu aktivieren, aktivieren Sie Create output for monitoring.
Programmatische Verwendung
Um den Block-Parameterwert programmatisch festzulegen, greifen Sie auf das Stateflow.StateTransitionTableChart-Objekt des Blocks zu und ändern Sie die Objekteigenschaft mithilfe der Punktschreibweise.
| Parameter: | DoNotAutogenerateEnum |
| Werte: | false or 0 (Standardeinstellung) | true or 1 |
| Datentypen: | logical |
Erweitert
Legt fest, ob die Zustandskonfiguration der Zustandsübergangstabelle zum Zeitpunkt 0 statt bei dem ersten Eingangsereignis initialisiert werden soll. Weitere Informationen finden Sie unter Execution of a Chart at Initialization.
Programmatische Verwendung
Um den Block-Parameterwert programmatisch festzulegen, greifen Sie auf das Stateflow.StateTransitionTableChart-Objekt des Blocks zu und ändern Sie die Objekteigenschaft mithilfe der Punktschreibweise.
| Parameter: | ExecuteAtInitialization |
| Werte: | false or 0 (Standardeinstellung) | true or 1 |
| Datentypen: | logical |
Legt fest, ob die Daten in der Zustandsübergangstabelle bei einem Ganzzahl-Überlauf gesättigt werden. Wenn Sie diesen Parameter deaktivieren, werden die Daten in der Zustandsübergangstabelle bei einem Ganzzahl-Überlauf umgebrochen. Weitere Informationen finden Sie unter Handle Integer and Enumeration Overflow for Chart Data.
Programmatische Verwendung
Um den Block-Parameterwert programmatisch festzulegen, greifen Sie auf das Stateflow.StateTransitionTableChart-Objekt des Blocks zu und ändern Sie die Objekteigenschaft mithilfe der Punktschreibweise.
| Parameter: | SaturateOnIntegerOverflow |
| Werte: | true or 1 (Standardeinstellung) | false or 0 |
| Datentypen: | logical |
Legt fest, ob die Ausgangsdaten jedes Mal, wenn die Zustandsübergangstabelle aufgeweckt wird, initialisiert werden sollen.
Wenn Sie diesen Parameter auswählen, setzt die Zustandsübergangstabelle ihre Ausgangswerte bei jedem Aufwecken der Zustandsübergangstabelle zurück, nicht nur zum Zeitpunkt 0. Die Zustandsübergangstabelle setzt die Ausgangswerte zurück, wenn ein Funktionsaufruf, ein Kantenauslöser oder ein Takt die Zustandsübergangstabelle auslöst. Wenn Sie einen anfänglichen Wert für ein Ausgangs-Datenobjekt festlegen, wird der Ausgang auf diesen Wert zurückgesetzt. Andernfalls wird der Ausgang auf null zurückgesetzt. Wählen Sie diesen Parameter aus, um:
Sicherzustellen, dass alle Ausgänge bei jeder Ausführung der Zustandsübergangstabelle definiert sind.
Ein Zwischenspeichern der Ausgänge zu vermeiden, d. h. zu verhindern, dass Ausgänge Werte annehmen, die in vorherigen Ausführungen berechnet wurden.
Bei allen Ausgängen der Zustandsübergangstabelle einen sinnvollen anfänglichen Wert bereitzustellen.
Weitere Informationen finden Sie unter Initial value.
Programmatische Verwendung
Um den Block-Parameterwert programmatisch festzulegen, greifen Sie auf das Stateflow.StateTransitionTableChart-Objekt des Blocks zu und ändern Sie die Objekteigenschaft mithilfe der Punktschreibweise.
| Parameter: | InitializeOutput |
| Werte: | false or 0 (Standardeinstellung) | true or 1 |
| Datentypen: | logical |
Legt fest, ob die Zustandsübergangstabelle Daten variabler Größe unterstützt. Weitere Informationen finden Sie unter Declare Variable-Size Data in Stateflow Charts.
Programmatische Verwendung
Um den Block-Parameterwert programmatisch festzulegen, greifen Sie auf das Stateflow.StateTransitionTableChart-Objekt des Blocks zu und ändern Sie die Objekteigenschaft mithilfe der Punktschreibweise.
| Parameter: | SupportVariableSizing |
| Werte: | true or 1 (Standardeinstellung) | false or 0 |
| Datentypen: | logical |
Legt fest, ob Super-Step-Semantik für die Zustandsübergangstabelle aktiviert werden soll. Wählen Sie diesen Parameter aus, um es der Zustandsübergangstabelle zu ermöglichen, bei jedem Zeitschritt mehrere Übergänge zu akzeptieren, bis ein stabiler Zustand erreicht wird. Diese Option ist nicht verfügbar, wenn. Weitere Informationen finden Sie unter Super Step Semantics.
Abhängigkeiten
Um diesen Parameter zu aktivieren, setzen Sie Update Method auf Discrete.
Programmatische Verwendung
Um den Block-Parameterwert programmatisch festzulegen, greifen Sie auf das Stateflow.StateTransitionTableChart-Objekt des Blocks zu und ändern Sie die Objekteigenschaft mithilfe der Punktschreibweise.
| Parameter: | EnableNonTerminalStates |
| Werte: | false or 0 (Standardeinstellung) | true or 1 |
| Datentypen: | logical |
Die maximale Anzahl Übergänge, die in einem Super-Step durchgeführt werden können. Weitere Informationen finden Sie unter Super Step Semantics.
Abhängigkeiten
Um diesen Parameter zu aktivieren, aktivieren Sie Enable super step semantics.
Programmatische Verwendung
Um den Block-Parameterwert programmatisch festzulegen, greifen Sie auf das Stateflow.StateTransitionTableChart-Objekt des Blocks zu und ändern Sie die Objekteigenschaft mithilfe der Punktschreibweise.
| Parameter: | NonTerminalMaxCounts |
| Werte: | 1000 (Standardeinstellung) | positive integer |
| Datentypen: | single | double | int8 | int16 | int32 | int64 | uint8 | uint16 | uint32 | uint64 |
Aktion, die Stateflow durchführen soll, wenn Super-Step die maximale Anzahl Übergänge in einem Super-Step überschreitet. Weitere Informationen finden Sie unter Super Step Semantics.
Abhängigkeiten
Um diesen Parameter zu aktivieren, aktivieren Sie Enable super step semantics.
Programmatische Verwendung
Um den Block-Parameterwert programmatisch festzulegen, greifen Sie auf das Stateflow.StateTransitionTableChart-Objekt des Blocks zu und ändern Sie die Objekteigenschaft mithilfe der Punktschreibweise.
| Parameter: | NonTerminalUnstableBehavior |
| Werte: | "Proceed" (Standardeinstellung) | "Throw Error" |
Seit R2023a
Legt fest, ob die Zustandsübergangstabelle nicht-skalare Daten mit einer Längendimension 1 als feste Größe behandelt. Wenn Sie diesen Parameter auswählen, behandelt die Zustandsübergangstabelle nicht-skalare Daten, die mindestens eine Längendimension 1 haben, als feste Größe, unabhängig davon, ob Sie die Dateneigenschaft Variable size aktivieren. Wenn Sie diesen Parameter deaktivieren, behandelt die Zustandsübergangstabelle nicht-skalare Daten mit aktivierter Eigenschaft Variable size als variable Größe.
Programmatische Verwendung
Um den Block-Parameterwert programmatisch festzulegen, greifen Sie auf das Stateflow.StateTransitionTableChart-Objekt des Blocks zu und ändern Sie die Objekteigenschaft mithilfe der Punktschreibweise.
| Parameter: | TreatDimensionOfLengthOneAsFixedSize |
| Werte: | true or 1 (Standardeinstellung) | false or 0 |
| Datentypen: | logical |
Aktionssprache, die zur Programmierung der Zustandsübergangstabelle verwendet werden soll, angegeben als MATLAB oder C. Weitere Informationen finden Sie unter Unterschiede zwischen MATLAB und C als Aktionssprache-Syntax.
Programmatische Verwendung
Um den Block-Parameterwert programmatisch festzulegen, greifen Sie auf das Stateflow.StateTransitionTableChart-Objekt des Blocks zu und ändern Sie die Objekteigenschaft mithilfe der Punktschreibweise.
| Parameter: | ActionLanguage |
| Werte: | "MATLAB" (Standardeinstellung) | "C" |
Von der Zustandsübergangstabelle implementierte Zustandsmaschinen-Semantik, festgelegt als Classic, Mealy oder Moore. Weitere Informationen finden Sie unter Überblick über Mealy- und Moore-Automaten.
Programmatische Verwendung
Um den Block-Parameterwert programmatisch festzulegen, greifen Sie auf das Stateflow.StateTransitionTableChart-Objekt des Blocks zu und ändern Sie die Objekteigenschaft mithilfe der Punktschreibweise.
| Parameter: | StateMachineType |
| Werte: | "Classic" (Standardeinstellung) | "Mealy" | "Moore" |
Festkomma-Eigenschaften
Geerbte Simulink-Signale, die als Fixed-Point Designer™ fi-Objekte behandelt werden sollen, festgelegt als einer dieser Werte:
Fixed-point– Die Zustandsübergangstabelle behandelt alle Festkomma-Eingänge alsfi-Objekte.Fixed-point & Integer– Die Zustandsübergangstabelle behandelt alle Festkomma- und Ganzzahlen-Eingänge alsfi-Objekte.
Dieser Parameter gilt nur für Zustandsübergangstabellen, die MATLAB als Aktionssprache verwenden.
Programmatische Verwendung
Um den Block-Parameterwert programmatisch festzulegen, greifen Sie auf das Stateflow.StateTransitionTableChart-Objekt des Blocks zu und ändern Sie die Objekteigenschaft mithilfe der Punktschreibweise.
| Parameter: | TreatAsFi |
| Werte: | "Fixed-point" (Standardeinstellung) | "Fixed-point & Integer" |
fimath-Standardobjekteigenschaften der Zustandsübergangstabelle, festgelegt als einer dieser Werte:
Same as MATLAB– Die Zustandsübergangstabelle verwendet dieselbenfimath-Objekteigenschaften wie das aktuellefimath-Standardobjekt. Das Textfeld wird abgedunkelt und zeigt das aktuelle globalefimath-Objekt schreibgeschützt an.Specify other– Legen Sie Ihr eigenesfimath-Objekt im Textfeld fest.
Weitere Informationen finden Sie unter fimath Object Construction (Fixed-Point Designer).
Abhängigkeiten
Um diesen Parameter zu aktivieren, setzen Sie Action Language auf MATLAB.
Programmatische Verwendung
Um den Block-Parameterwert programmatisch festzulegen, greifen Sie auf das Stateflow.StateTransitionTableChart-Objekt des Blocks zu und ändern Sie die Objekteigenschaft mithilfe der Punktschreibweise.
| Parameter: | EmlDefaultFimath |
| Werte: | "Same as MATLAB Default" (Standardeinstellung) | "Other:UserSpecified" |
Tipps
Bestimmte Simulink-Funktionen hängen von der Stateflow-Funktionalität ab. Daher enthält die Simulink-Installation einen Stateflow-Produktcode. Sie können die Modelle in der Stateflow-Dokumentation ohne explizite Installation von Stateflow öffnen. Zum Öffnen anderer Modelle, die Stateflow-Blöcke verwenden, ist eine Stateflow-Lizenz erforderlich.