Spektralschätzung
Analysieren Sie den Spektralgehalt von gleichmäßig oder ungleichmäßig abgetasteten Signalen mithilfe von periodogram, pwelch oder plomb. Schärfen Sie Periodogrammschätzungen durch Neuzuordnung. Ermitteln Sie die Kohärenz zwischen den Signalen im Frequenzbereich. Schätzen Sie Übertragungsfunktionen auf Basis von Eingangs- und Ausgangsmessungen. Untersuchen Sie MIMO-Systeme im Frequenzbereich.
Apps
| Signal Analyzer | Mehrere Signale und Spektren visualisieren und vergleichen |
Live Editor Tasks
| Diagramm erstellen | Interactively visualize filter responses and other outputs for several signal processing functions (Seit R2023a) |
Funktionen
Themen
- Nonparametric Methods
Learn about the periodogram, modified periodogram, Welch, and multitaper methods of nonparametric spectral estimation.
- Detect a Distorted Signal in Noise
Use frequency analysis to characterize a signal embedded in noise.
- Measure the Power of a Signal
Estimate the width of the frequency band that contains most of the power of a signal. For distorted signals, determine the power stored in the fundamental and the harmonics.
- Amplitude Estimation and Zero Padding
Obtain an accurate estimate of the amplitude of a sinusoidal signal using zero padding.
- Bias and Variability in the Periodogram
Reduce bias and variability in the periodogram using windows and averaging.
- Compare the Frequency Content of Two Signals
Identify similarity between signals in the frequency domain.
- Find Periodicity Using Frequency Analysis
Spectral analysis helps characterize oscillatory behavior in data and measure the different cycles.
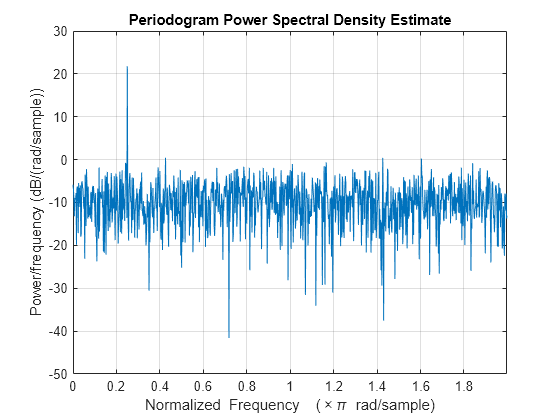
- Significance Testing for Periodic Component
Assess the significance of a sinusoidal component in white noise using Fisher's g-statistic.
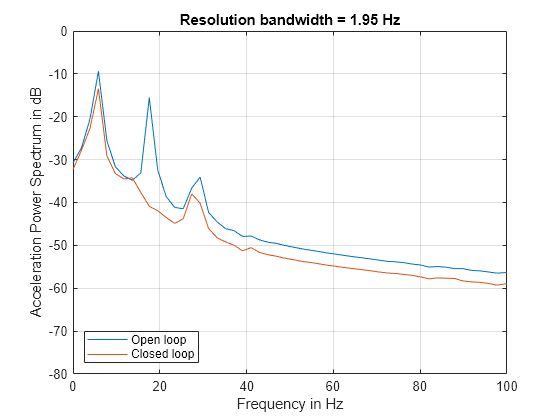
- Cross Spectrum and Magnitude-Squared Coherence
Obtain the phase lag between sinusoidal components and identify frequency-domain correlation in a time series.
- Price Weather Derivatives (Financial Instruments Toolbox)
This example demonstrates a workflow for pricing weather derivatives based on historically observed temperature data.
Enthaltene Beispiele
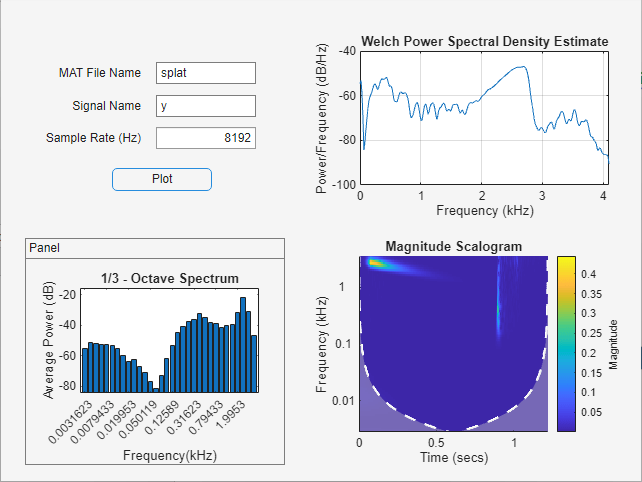
Plot Spectral Representations of Signal in App Designer
Create and run an app that plots Welch's PSD estimate, octave spectrum, and scalogram of a signal.
Practical Introduction to Frequency-Domain Analysis
Perform and interpret basic frequency-domain signal analysis using simulated and real data.
Power Spectral Density Estimates Using FFT
Obtain nonparametric PSD estimates equivalent to the periodogram using the FFT directly.

Frequency-Domain Linear Regression
Construct a linear regression model for a time series using the discrete Fourier transform.
Detect Periodicity in a Signal with Missing Samples
Use the Lomb-Scargle periodogram to study the periodicity of an irregularly sampled signal.

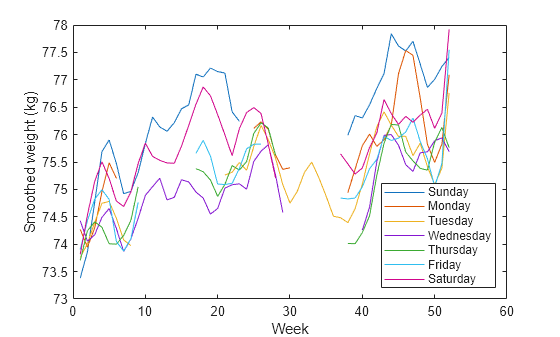
Find Periodicity in a Categorical Time Series
Perform spectral analysis of data whose values are not inherently numerical.