poctave
Generate octave spectrum
Syntax
Description
p = poctave(x,fs)x sampled at a rate
fs. The octave spectrum is the average power over
octave bands as defined by the ANSI S1.11 standard [2]. If
x is a matrix, then the function estimates the octave
spectrum independently for each column and returns the result in the
corresponding column of p.
p = poctave(___,Name,Value)
poctave(___) with no output arguments plots
the octave spectrum or spectrogram in the current figure. If
type is specified as 'spectrogram',
then this function is supported only for single-channel input.
Examples
Generate samples of white Gaussian noise. Create a signal of pseudopink noise by filtering the white noise with a filter whose zeros and poles are all on the positive x-axis. Visualize the zeros and poles.
N = 1e5;
wn = randn(N,1);

z = [0.982231570015379 0.832656605953720 0.107980893771348]';
p = [0.995168968915815 0.943841773712820 0.555945259371364]';

[b,a] = zp2tf(z,p,1);
pn = filter(b,a,wn);

zplane(z,p)

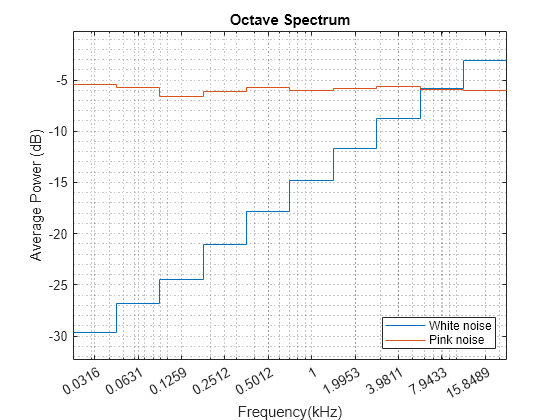
Create a two-channel signal consisting of white and pink noise. Compute the octave spectrum. Assume a sample rate of 44.1 kHz. Set the frequency band from 30 Hz to the Nyquist frequency.
sg = [wn pn];

fs = 44100;

poctave(sg,fs,'FrequencyLimits',[30 fs/2])
legend('White noise','Pink noise','Location','SouthEast')

The white noise has an octave spectrum that increases with frequency. The octave spectrum of the pink noise is approximately constant throughout the frequency range. The octave spectrum of a signal illustrates how the human ear perceives the signal.
Generate samples of white Gaussian noise sampled at 44.1 kHz. Create a signal of pink noise by filtering the white noise with a filter whose zeros and poles are all on the positive x-axis.
N = 1e5;
fs = 44.1e3;
wn = randn(N,1);

z = [0.982231570015379 0.832656605953720 0.107980893771348]';
p = [0.995168968915815 0.943841773712820 0.555945259371364]';
[b,a] = zp2tf(z,p,1);

pn = filter(b,a,wn);
Compute the Welch estimate of the power spectral density for both signals. Divide the signals into 2048-sample segments, specify 50% overlap between adjoining segments, window each segment with a Hamming window, and use 4096 DFT points.
[pxx,f] = pwelch([wn pn],hamming(2048),1024,4096,fs);
Display the spectral densities over a frequency band ranging from 200 Hz to the Nyquist frequency. Use a logarithmic scale for the frequency axis.
pwelch([wn pn],hamming(2048),1024,4096,fs)
ax = gca;
ax.XScale = "log";
xlim([200 fs/2]/1000)
legend("White","Pink")

Compute and display the octave spectra of the signals. Use the same frequency range as in the previous plot. Specify six bands per octave and compute the spectra using 8th-order filters.
poctave(pxx,fs,f,"psd", ...
    BandsPerOctave=6,FilterOrder=8,FrequencyLimits=[200 fs/2])
legend("White","Pink")

Read an audio recording of an electronic toothbrush into MATLAB®. The toothbrush turns on at about 1.75 seconds and stays on for approximately 2 seconds.
[y,fs] = audioread("toothbrush.m4a");Compute the octave spectrogram of the audio signal. Specify 48 bands per octave and 82% overlap. Restrict the total frequency range from 100 Hz to fs/2 Hz and use C-weighting.
poctave(y,fs,"spectrogram",BandsPerOctave=48, ...
    OverlapPercent=82,FrequencyLimits=[100 fs/2],Weighting="C")

Generate samples of white Gaussian noise sampled at 44.1 kHz. Create a signal of pink noise by filtering the white noise with a filter whose zeros and poles are all on the positive x-axis.
N = 1e5;
fs = 44.1e3;
wn = randn(N,1);

z = [0.982231570015379 0.832656605953720 0.107980893771348]';
p = [0.995168968915815 0.943841773712820 0.555945259371364]';
[b,a] = zp2tf(z,p,1);

pn = filter(b,a,wn);
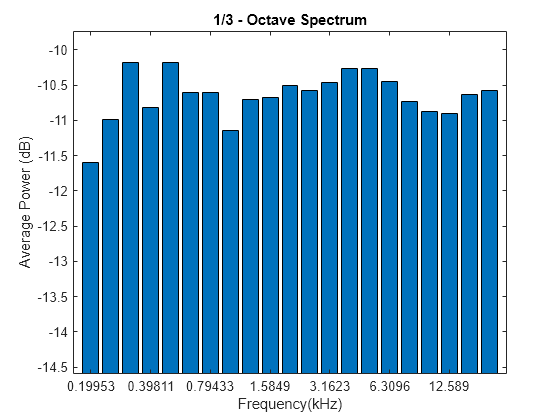
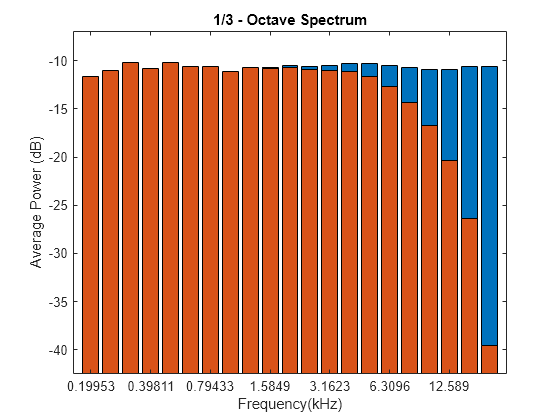
Compute the octave spectrum of the signal. Specify three bands per octave and restrict the total frequency range from 200 Hz to 20 kHz. Store the name-value pairs in a cell array for later use. Display the spectrum.
flims = [200 20e3];
bpo = 3;
opts = {'FrequencyLimits',flims,'BandsPerOctave',bpo};

poctave(pn,fs,opts{:});
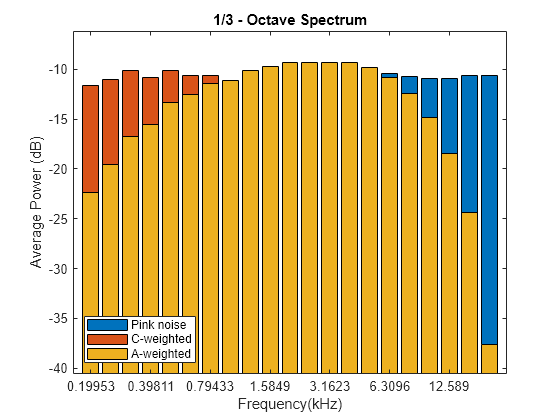
Compute the octave spectrum of the signal with the same settings, but use C-weighting. The C-weighted spectrum falls off at frequencies above 6 kHz.
hold on
poctave(pn,fs,opts{:},'Weighting','C')

Compute the octave spectrum again, but now use A-weighting. The A-weighted spectrum peaks at about 3 kHz and falls off above 6 kHz and at the lower end of the frequency band.
poctave(pn,fs,opts{:},'Weighting','A')
hold off
legend('Pink noise','C-weighted','A-weighted','Location','SouthWest')
Input Arguments
Input signal, specified as a vector or matrix. If x
is a vector, then poctave treats it as a single
channel. If x is a matrix, then
poctave computes the octave spectrum or spectrogram
independently for each column and returns the result in the corresponding
column of p. If type is set to
'spectrogram', the function concatenates the
spectrograms along the third dimension of p.
Example: sin(2*pi*(0:127)/16)+randn(1,128)/100 specifies
a noisy sinusoid.
Example: [2 1].*sin(2*pi*(0:127)'./[16 64]) specifies a
two-channel sinusoid.
Data Types: single | double
Sample rate, specified as a positive scalar expressed in hertz. The sample rate cannot be lower than 7 Hz.
Input timetable. xt must contain increasing, finite,
uniformly spaced row times. If xt represents a
multichannel signal, then it must have either a single variable containing a
matrix or multiple variables consisting of vectors.
If a timetable has missing or duplicate time points, you can fix it using the tips in Clean Timetable with Missing, Duplicate, or Nonuniform Times.
Example: timetable(seconds(0:4)',randn(5,1)) specifies a
random process sampled at 1 Hz for 4 seconds.
Power spectral density (PSD), specified as a vector or matrix with real
nonnegative elements. The power spectral density must be expressed in linear
units, not decibels. Use db2pow to convert decibel
values to power values. If type is
'spectrogram', then each column in
pxx is considered to be the PSD for a particular
time window or sample.
Example: [pxx,f] =
periodogram(cos(pi./[4;2]*(0:159))'+randn(160,2)) specifies
the periodogram PSD estimate of a noisy two-channel sinusoid sampled at 2π
Hz and the frequencies at which it is computed.
PSD frequencies, specified as a vector. f must be
finite, strictly increasing, and uniformly spaced in the linear
scale.
Example: [pxx,f] =
periodogram(cos(pi./[4;2]*(0:159))'+randn(160,2)) specifies
the periodogram PSD estimate of a noisy two-channel sinusoid sampled at 2π
Hz and the frequencies at which it is computed.
Type of spectrum to compute, specified as 'power' or
'spectrogram'.
'power'— Compute the octave power spectrum of the input.'spectrogram'— Compute the octave spectrogram of the input. The function divides the input into segments and returns the short-time octave power spectrum of each segment.
Name-Value Arguments
Specify optional pairs of arguments as
Name1=Value1,...,NameN=ValueN, where Name is
the argument name and Value is the corresponding value.
Name-value arguments must appear after other arguments, but the order of the
pairs does not matter.
Before R2021a, use commas to separate each name and value, and enclose
Name in quotes.
Example: 'Weighting','A','FilterOrder',8 computes the octave
spectrum using A-weighting and 8th-order filters.
Number of subbands in the octave band, specified as
1, 3/2, 2,
3, 6, 12,
24, 48, or
96. This parameter dictates the width of a
fractional-octave band. In such a frequency band, the upper edge
frequency is the lower edge frequency times 21/b, where b is the number of
subbands.
Data Types: single | double
Order of bandpass filters, specified as a positive even integer.
Data Types: single | double
Frequency band, specified as an increasing two-element vector
expressed in hertz. The lower value of the vector must be at least 3 Hz.
The upper value of the vector must be smaller than or equal to the
Nyquist frequency. If the vector does not contain an octave center,
poctave may return a center frequency outside
the specified limits. To ensure a stable filter design, the actual
minimum achievable frequency limit increases to
3* if the sample
rate exceeds 48 kHz. If this argument is not specified,
fs/48e3poctave uses the interval
[.max(3,3*fs/48e3)
fs/2]
Data Types: single | double
Frequency weighting, specified as one of these:
'none'—poctavedoes not perform any frequency weighting on the input.'A'—poctaveperforms A-weighting on the input. The ANSI S1.42 standard defines the A-weighting curve. The IEC 61672-1 standard defines the minimum and maximum attenuation limits for an A-weighting filter. The ANSI S1.42.2001 standard defines the weighting curve by specifying analog poles and zeros.'C'—poctaveperforms C-weighting on the input. The ANSI S1.42 standard defines the C-weighting curve. The IEC 61672-1 standard defines the minimum and maximum attenuation limits for a C-weighting filter. The ANSI S1.42.2001 standard defines the weighting curve by specifying analog poles and zeros.Vector —
poctavetreats the input as a vector of coefficients that specify a finite impulse response (FIR) filter.Matrix —
poctavetreats the input as a matrix of second-order section coefficients that specify an infinite impulse response (IIR) filter. The matrix must have at least two rows and exactly six columns.1-by-2 cell array —
poctavetreats the input as the numerator and denominator coefficients, in that order, that specify the transfer function of an IIR filter.digitalFilterobject —poctavetreats the input as a filter that was designed usingdesignfilt.
This argument is supported only when the input is a signal. Octave smoothing does not support frequency weighting.
Example: 'Weighting',fir1(30,0.5) specifies a
30th-order FIR filter with a normalized cutoff frequency of
0.5π rad/sample.
Example: 'Weighting',[2 4 2 6 0 2;3 3 0 6 0 0]
specifies a third-order Butterworth filter with a normalized 3 dB
frequency of 0.5π rad/sample.
Example: 'Weighting',{[1 3 3 1]/6 [3 0 1]/3}
specifies a third-order Butterworth filter with a normalized 3 dB
frequency of 0.5π rad/sample.
Example: 'Weighting',designfilt('lowpassiir','FilterOrder',3,'HalfPowerFrequency',0.5)
specifies a third-order Butterworth filter with a normalized 3 dB
frequency of 0.5π rad/sample.
Data Types: single | double | char | string | cell
Lower bound for nonzero values, specified as a real scalar. The
function sets those elements of p such that 10 log10(p)
≤ 'MinThreshold' to zero. Specify 'MinThreshold'
in decibels.
Data Types: single | double
Length of data segments, specified as a nonnegative integer.
'WindowLength' must be less than or equal to
the length of the input signal. If not specified, the length of data
segments is calculated based on the size of the input signal. This input
is valid only when type is
'spectrogram'.
Data Types: single | double
Overlap percent between adjoining segments, specified as a real scalar
in the interval [0, 100). If not specified,
'OverlapPercent' is zero. This input is valid
only when type is
'spectrogram'.
Data Types: single | double
Output Arguments
Octave spectrum or spectrogram, returned as a vector, matrix, or 3-D array. The third dimension, if present, corresponds to the input channels.
Center frequencies, returned as a vector. cf contains
a list of center frequencies of the octave bands over which
poctave estimated the octave spectrum.
cf has units of hertz.
Algorithms
Octave analysis is used to identify sound or vibration levels across a broad frequency range in a process that resembles how a human ear perceives sound. The signal spectrum is split into octave or fractional-octave bands. The frequency limit of each band is twice the lower frequency limit, thus the bandwidth increases at higher frequencies.
To perform octave analysis, the poctave function creates
a filter bank of parallel bandpass filters. Each digital bandpass filter is mapped
to an equivalent Butterworth lowpass analog filter [3]. The analog
filter is mapped back to a digital bandpass filter using a bandpass version of the
bilinear transformation, and the
result is returned as a cascade of fourth-order sections.
The ANSI S1.11-2004 standard [2] defines the center frequencies of the octave bands as
where:
fr is the reference frequency, 1000 Hz.
G is the octave ratio, 100.3.
b is the number of bands per octave, which is specified by
BandsPerOctave.k is any integer and represents the band number.
The center frequency definition differs depending on whether b is odd, such as for bandwidths of 1 octave or 1/3 octave, or even, such as for bandwidths of 1/2 octave or 1/6 octave. This ensures that the band edges of the whole octave band remain band edges for all of the fractional bands.
The lower and upper edge frequencies of each octave band are given by
For more information on the design and implementation of octave filters, see Digital Filter Design (Audio Toolbox).
The poctave function calculates the average power over
each octave band by integrating the power spectral density (PSD) of the signal
within the band using the rectangle method. The average power of an octave band
represents the signal level at the band center frequency.
When a band edge falls within a bin, the function assigns to the band only the fraction of power corresponding to the percentage of the frequency bin that the band occupies. For example, this diagram shows an octave band whose edges fall within two different frequency bins, represented by orange and blue dashed rectangles. The power within the shaded regions is computed for the given octave band.
When a band edge falls at 0 or at the Nyquist frequency, fNyquist, the function assigns to the band two times the fraction of power corresponding to the percentage of the frequency bin that the band occupies. This duplication accounts for the half bin power that is present in the range [–w/
2,0] and [fNyquist, fNyquist + w/2], where w is the bin width. For example, this diagram shows an octave band whose right edge falls at the Nyquist frequency. The power within the shaded region is computed for the given octave band.
References
[1] Smith, Julius Orion, III. "Example: Synthesis of 1/F Noise (Pink Noise)." In Spectral Audio Signal Processing. https://ccrma.stanford.edu/~jos/sasp/.
[2] Specification for Octave-Band and Fractional-Octave-Band Analog and Digital Filters. ANSI Standard S1.11-2004. Melville, NY: Acoustical Society of America, 2004.
[3] Orfanidis, Sophocles J. Introduction to Signal Processing. Englewood Cliffs, NJ: Prentice Hall, 2010.
Extended Capabilities
Usage notes and limitations:
If input weighting is specified as a variable-size matrix during code generation, then it must not reduce to a vector at runtime.
The poctave function
supports GPU array input with these usage notes and limitations:
The
poctavefunction may generate low-frequency octave filters that are unstable and not supported withgpuArrayinputs. Use the optionalFrequencyLimitsname-value argument to increase the lower band frequency or downsample the input signal.
For more information, see Run MATLAB Functions on a GPU (Parallel Computing Toolbox).
Version History
Introduced in R2018aThe poctave function supports gpuArray
objects. You must have Parallel Computing Toolbox™ to use this functionality. For more information, see GPU Arrays.
See Also
MATLAB Command
You clicked a link that corresponds to this MATLAB command:
Run the command by entering it in the MATLAB Command Window. Web browsers do not support MATLAB commands.
Website auswählen
Wählen Sie eine Website aus, um übersetzte Inhalte (sofern verfügbar) sowie lokale Veranstaltungen und Angebote anzuzeigen. Auf der Grundlage Ihres Standorts empfehlen wir Ihnen die folgende Auswahl: .
Sie können auch eine Website aus der folgenden Liste auswählen:
So erhalten Sie die bestmögliche Leistung auf der Website
Wählen Sie für die bestmögliche Website-Leistung die Website für China (auf Chinesisch oder Englisch). Andere landesspezifische Websites von MathWorks sind für Besuche von Ihrem Standort aus nicht optimiert.
Amerika
- América Latina (Español)
- Canada (English)
- United States (English)
Europa
- Belgium (English)
- Denmark (English)
- Deutschland (Deutsch)
- España (Español)
- Finland (English)
- France (Français)
- Ireland (English)
- Italia (Italiano)
- Luxembourg (English)
- Netherlands (English)
- Norway (English)
- Österreich (Deutsch)
- Portugal (English)
- Sweden (English)
- Switzerland
- United Kingdom (English)