Fit Postprocessing
After fitting a curve or surface, use postprocessing methods to analyze if the fit to the data is accurate. After creating a fit, you can apply various postprocessing methods for plotting, interpolation, and extrapolation; estimating confidence intervals; and calculating integrals and derivatives. You can also use postprocessing methods to determine the outliers of a fit.
You can use Curve Fitting Toolbox™ functions to evaluate a fit by plotting the residuals and the prediction bounds. For more information, see Evaluate Curve Fit. To compare fits and generate MATLAB code interactively, use the Curve Fitter app.
Apps
| Curve Fitter | Fit curves and surfaces to data |
Functions
cfit | Constructor for cfit object |
coeffnames | Coefficient names of cfit, sfit, or fittype object |
coeffvalues | Coefficient values of cfit or sfit object |
confint | Confidence intervals for fit coefficients of cfit or sfit object |
differentiate | Differentiate cfit or sfit object |
feval | Evaluate cfit, sfit, or
fittype object |
integrate | Integrate cfit object |
plot | Plot cfit or sfit object |
predint | Prediction intervals for cfit or sfit object |
probvalues | Problem-dependent parameter values of cfit or sfit object |
quad2d | Numerically integrate sfit object |
sfit | Constructor for sfit object |
Topics
- Create Multiple Fits in Curve Fitter App
Workflow for refining your fit, comparing multiple fits, and using statistics to determine the best fit.
- Explore and Customize Plots
In the Curve Fitter app, display fit, residual, surface, or contour plots; display prediction bounds and multiple plots; use zoom, pan, data cursor, and outliers modes; change colormap of surface and contour plots, change axes limits and print plots.
- Export Fit from Curve Fitter App to Simulink Lookup Table
Export a surface fit from the Curve Fitter app to a Simulink® 2-D lookup table.
- Remove Outliers
Remove points interactively or exclude them by rule in the Curve Fitter app. Alternatively, exclude outliers by using the
fitfunction. You can exclude data based on their distance from the model, in standard deviations. - Select Validation Data
Compare your fit with validation data or test set in the Curve Fitter app.
- Generate Code and Export Fits to the Workspace
Generate MATLAB code from an interactive session in the Curve Fitter app, recreate fits and plots, and analyze fits in the workspace.
- Evaluate Curve Fit
This example shows how to work with a curve fit.
- Evaluate Surface Fit
This example shows how to work with a surface fit.
- Evaluating Goodness of Fit
After fitting data with one or more models, evaluate the goodness of fit using plots, statistics, residuals, and confidence and prediction bounds.
- Compare Fits in Curve Fitter App
Find the best fit by comparing visual and numeric results, including fitted coefficients and goodness-of-fit statistics.
- Compare Fits Programmatically
This example shows how to fit and compare polynomials up to sixth degree using Curve Fitting Toolbox™, fitting some census data.
- Residual Analysis
The residuals from a fitted model are defined as the differences between the response data and the fit to the response data at each predictor value.
- Confidence and Prediction Bounds
Curve Fitting Toolbox software lets you calculate confidence bounds for the fitted coefficients, and prediction bounds for new observations or for the fitted function.
- Differentiating and Integrating a Fit
This example shows how to find the first and second derivatives of a fit, and the integral of the fit, at the predictor values.
Featured Examples

Evaluate Curve Fit
Work with a curve fit.
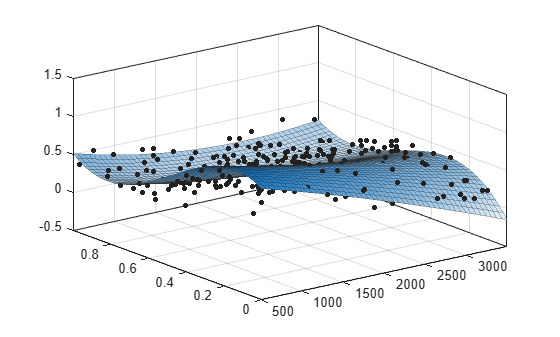
Evaluate Surface Fit
Work with a surface fit.

Compare Fits Programmatically
Fit and compare polynomials up to sixth degree using Curve Fitting Toolbox™, fitting some census data. It also shows how to fit a single-term exponential equation and compare this to the polynomial models.

Differentiating and Integrating a Fit
Find the first and second derivatives of a fit, and the integral of the fit, at the predictor values.