Export Fit from Curve Fitter App to Simulink Lookup Table
This example shows how to create a surface fit using the Curve Fitter app, and then export the fit to a Simulink® 2-D Lookup Table (Simulink). You can follow the same workflow to export a curve fit to a 1-D Lookup Table (Simulink).
Create Surface Fit in Curve Fitter App
Load the BatteryDataFitter data set.
load BatteryDataFitterThe table batteryMeasurementData in the data set contains three battery measurement variables: Temperature, SOC (State of Charge), and Resistance.
Open the Curve Fitter app.
curveFitter
Alternatively, on the Apps tab click the Show more arrow to display the apps gallery. In in the Math, Statistics and Optimization group, click Curve Fitter.
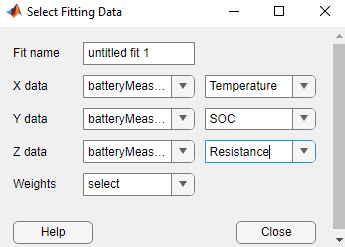
In the Curve Fitter app, select the data variables for the fit. On the Curve Fitter tab, in the Data section, click Select Data. In the Select Fitting Data dialog box, select the table name batteryMeasurementData for each data variable. Then, select Temperature as the X data value, SOC as the Y data value, and Resistance as the Z data value.
The Curve Fitter app plots the data points as you select variables. By default, the app creates an interpolant surface fit that passes through the data points. To obtain a smoother fit, in the Fit Options pane, select Cubic spline for Interpolation method. For more information about interpolation methods, see About Interpolation Methods.
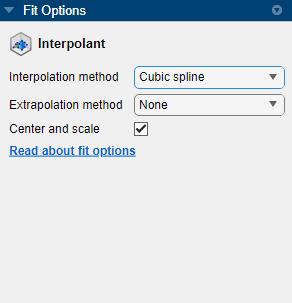
The app creates an interpolant fit with cubic spline interpolation and no extrapolation. The data has two outliers at the maximum and minimum values of Resistance. To remove the outliers, click Exclude outliers on the axes toolbar, and then click each outlier in the fit plot.
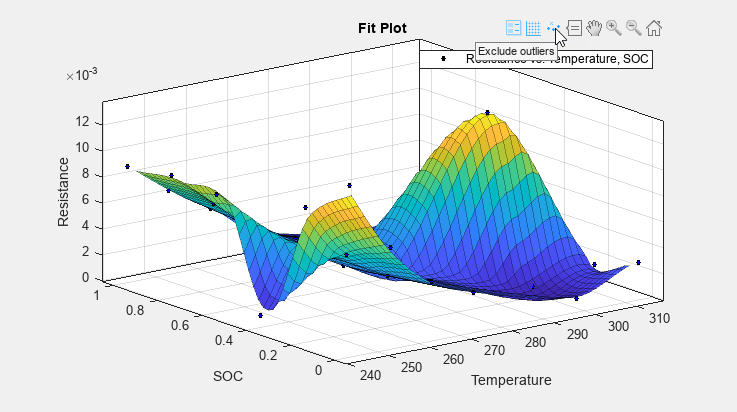
The interpolant surface fit plot now excludes the two outliers.

By default, the app does not extrapolate outside of the fitting data's convex hull for the cubic spline interpolation method. To estimate Resistance outside of the convex hull using nearest neighbor extrapolation, select Nearest neighbor for Extrapolation method in the Fit Options pane. For more information about extrapolation methods, see Extrapolation for Interpolant Fit Types.
The extrapolated Resistance values appear as steps that surround the fitting data domain.

Export Fit to Simulink Lookup Table
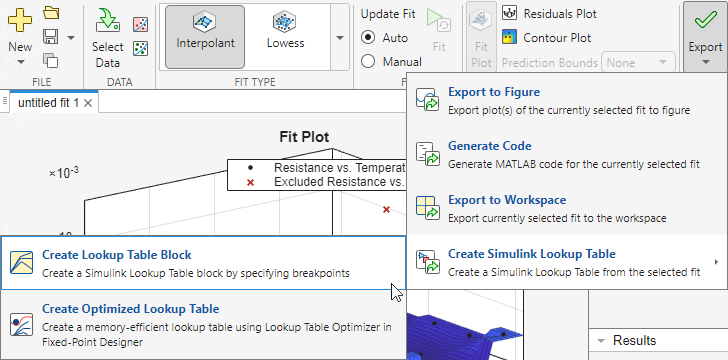
In the Curve Fitter app, in the Export section, click Export and select Create Simulink Lookup Table. Then, select Create Lookup Table Block. You can also export a fit to the Lookup Table Optimizer app (Fixed-Point Designer). For more information, see Lookup Table Optimizer (Fixed-Point Designer).
Use the Create Simulink Lookup Table dialog box to specify the Breakpoints 1 and Breakpoints 2 values for the Temperature and SOC variables, respectively. You can specify the breakpoints as a set of explicit or even-spaced values.
The Explicit values option allows you to specify the breakpoints by using any expression that returns a vector. For example, you can use the colon operator (as shown in the following figure), a comma-separated list (for example, 240, 255.6, 271.2, 286.8, 302.4), or a function (for example, exp(1:10)). The Lookup table preview section shows a preview of the Simulink lookup table with a heat map corresponding to the table values.

The Even spacing option allows you to specify a set of evenly spaced breakpoints. For each breakpoint set, specify the first point, spacing, and number of points.

In this case, accept the default options and click Export Table to Simulink to export the fit and extrapolated values to a Simulink lookup table.
Simulink Model with Lookup Table
The app opens a new Simulink model containing a 2-D lookup table block. The name of the block is surfaceblock (or curveblock if you create it from a curve fit). The model also has two constant inputs (or one input for a curve fit) and a display output.

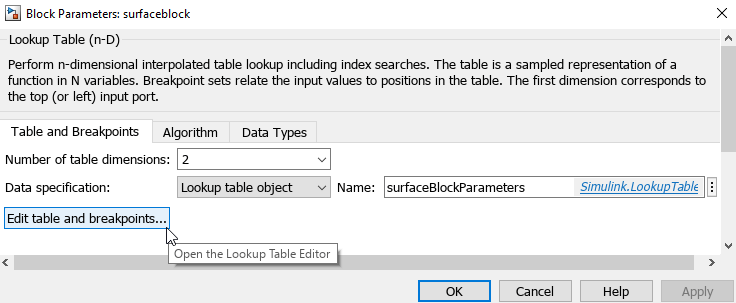
Note that the extrapolation method for the block is different from the extrapolation method used during surface fitting. By default, Extrapolation method is set to Clip. You can edit Extrapolation method and other methods by double-clicking the lookup table block and displaying the Algorithm tab in the Block Parameters dialog box.

To view and edit the breakpoints, click Edit table and breakpoints on the Table and Breakpoints tab of the Block Parameters dialog box. For an example of how to edit the breakpoints, see Enter Data in Lookup Table Editor (Simulink).
Use Lookup Table in Another Simulink Model
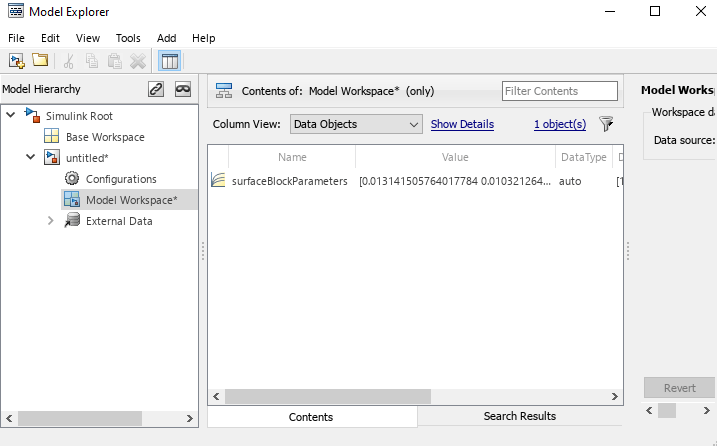
You can use the lookup table created by the Curve Fitter app in another Simulink model. Copy the surfaceblock block and paste it into a new or existing model. You must also copy and paste surfaceBlockParameters from the model workspace of the current model to the other model's workspace. surfaceBlockParameters is a Simulink.LookupTable (Simulink) object. To find the surfaceBlockParameters object, on the Modeling tab, in the Design section, click the arrow to display the gallery and select Model Workspace under Repositories. In the model workspace, you can also configure the code generation settings.
See Also
Apps
Blocks
- 2-D Lookup Table (Simulink) | 1-D Lookup Table (Simulink)
Objects
Simulink.LookupTable(Simulink)