Line
R2026bLine region of interest
Description
A Line object specifies the length and position of an axes-based
linear region of interest (ROI). You can customize the appearance and interactive behavior of
the ROI.
Axes-based ROIs enable you to draw and edit regions of interest
on images displayed using imshow or in MATLAB® axes. Axes-based ROIs offer maximum customization of appearance and behavior,
including line width, marker style, and edge color. Use axes-based ROIs for fine-grained control
over ROI appearance, integration with existing axes-based apps, or access to the assisted
freehand, crosshair, or cuboid ROI types. For a comparison of axes-based ROIs with other ROIs,
see Choose Approach to Annotate ROIs in Images.
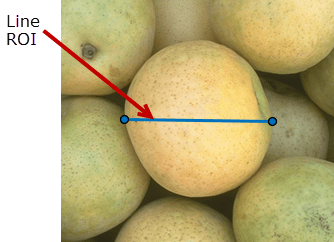
For more information about using this ROI, including keyboard shortcuts, see Tips.
Creation
There are two ways to create a Line object. For more information, see
Create Axes-Based ROIs.
Use the
drawlinefunction. Use this function when you want to create the ROI and set the appearance in a single command. You can specify the length and position of the ROI interactively by drawing the ROI over an image using the mouse, or programmatically by using name-value arguments.Use the
images.roi.Linefunction described here. Use this function when you want to specify the appearance and behavior of the ROI before you specify the length and position of the ROI. After creating the object, you can specify the length and position interactively by using thedrawfunction or programmatically by modifying properties of the object.
Description
roi = images.roi.LineLine object with default properties.
roi = images.roi.Line(ax)ax.
roi = images.roi.Line(___,PropertyName=Value)
Example: images.roi.Line(Color="y") creates a yellow colored
Line object.
Input Arguments
Properties
Shape and Position
Position of the ROI, specified as a 2-by-2 numeric matrix of the form [x1
y1; x2 y2]. Each row specifies the respective end-point of the line
segment. You can also set this property by drawing or moving the line.
Color and Styling
ROI color, specified as an RGB triplet, a hexadecimal color code, a color name, or a short color name.
For a custom color, specify an RGB triplet or a hexadecimal color code.
An RGB triplet is a three-element row vector whose elements specify the intensities of the red, green, and blue components of the color. The intensities must be in the range
[0,1], for example,[0.4 0.6 0.7].A hexadecimal color code is a string scalar or character vector that starts with a hash symbol (
#) followed by three or six hexadecimal digits, which can range from0toF. The values are not case sensitive. Therefore, the color codes"#FF8800","#ff8800","#F80", and"#f80"are equivalent.
Alternatively, you can specify some common colors by name. This table lists the named color options, the equivalent RGB triplets, and the hexadecimal color codes.
| Color Name | Short Name | RGB Triplet | Hexadecimal Color Code | Appearance |
|---|---|---|---|---|
"red" | "r" | [1 0 0] | "#FF0000" |
|
"green" | "g" | [0 1 0] | "#00FF00" |
|
"blue" | "b" | [0 0 1] | "#0000FF" |
|
"cyan"
| "c" | [0 1 1] | "#00FFFF" |
|
"magenta" | "m" | [1 0 1] | "#FF00FF" |
|
"yellow" | "y" | [1 1 0] | "#FFFF00" |
|
"black" | "k" | [0 0 0] | "#000000" |
|
"white" | "w" | [1 1 1] | "#FFFFFF" |
|








This table lists the default color palettes for plots in the light and dark themes.
| Palette | Palette Colors |
|---|---|
Before R2025a: Most plots use these colors by default. |
|
|
|


You can get the RGB triplets and hexadecimal color codes for these palettes using the
orderedcolors
and rgb2hex
functions. For example, get the RGB triplets for the "gem" palette and
convert them to hexadecimal color
codes.
RGB = orderedcolors("gem");
H = rgb2hex(RGB);
Example: Color="r"
Example: Color="green"
Example: Color=[0 0.4470 0.7410]
Example: Color="#00FFFF"
Width of the ROI border, specified as a positive number in points. The default value is three times the number of points per screen pixel, such that the border is three pixels wide.
Marker size, specified as a positive number in points. The default value is eight times the number of points per screen pixel, such that markers are eight pixels in size.
Color of the ROI when selected, specified as an RGB triplet, a hexadecimal color code,
a color name, a short color name, or "none". If you specify
"none", then the value of Color defines the
color of the ROI for all states, selected or not.
For a custom color, specify an RGB triplet or a hexadecimal color code.
An RGB triplet is a three-element row vector whose elements specify the intensities of the red, green, and blue components of the color. The intensities must be in the range
[0,1], for example,[0.4 0.6 0.7].A hexadecimal color code is a string scalar or character vector that starts with a hash symbol (
#) followed by three or six hexadecimal digits, which can range from0toF. The values are not case sensitive. Therefore, the color codes"#FF8800","#ff8800","#F80", and"#f80"are equivalent.
Alternatively, you can specify some common colors by name. This table lists the named color options, the equivalent RGB triplets, and the hexadecimal color codes.
| Color Name | Short Name | RGB Triplet | Hexadecimal Color Code | Appearance |
|---|---|---|---|---|
"red" | "r" | [1 0 0] | "#FF0000" |
|
"green" | "g" | [0 1 0] | "#00FF00" |
|
"blue" | "b" | [0 0 1] | "#0000FF" |
|
"cyan"
| "c" | [0 1 1] | "#00FFFF" |
|
"magenta" | "m" | [1 0 1] | "#FF00FF" |
|
"yellow" | "y" | [1 1 0] | "#FFFF00" |
|
"black" | "k" | [0 0 0] | "#000000" |
|
"white" | "w" | [1 1 1] | "#FFFFFF" |
|
This table lists the default color palettes for plots in the light and dark themes.
| Palette | Palette Colors |
|---|---|
Before R2025a: Most plots use these colors by default. |
|
|
|
You can get the RGB triplets and hexadecimal color codes for these palettes using the
orderedcolors
and rgb2hex
functions. For example, get the RGB triplets for the "gem" palette and
convert them to hexadecimal color
codes.
RGB = orderedcolors("gem");
H = rgb2hex(RGB);
Example: SelectedColor="r"
Example: SelectedColor="green"
Example: SelectedColor=[0 0.4470 0.7410]
Example: SelectedColor="#00FFFF"
Color of the ROI stripe, specified as an RGB triplet, a hexadecimal color code, a
color name, a short color name, or "none". If you specify
"none", then the ROI edge is a solid color specified by
Color. Otherwise, the edge of the ROI is striped, with colors
alternating between the colors specified by Color and
StripeColor.
For a custom color, specify an RGB triplet or a hexadecimal color code.
An RGB triplet is a three-element row vector whose elements specify the intensities of the red, green, and blue components of the color. The intensities must be in the range
[0,1], for example,[0.4 0.6 0.7].A hexadecimal color code is a string scalar or character vector that starts with a hash symbol (
#) followed by three or six hexadecimal digits, which can range from0toF. The values are not case sensitive. Therefore, the color codes"#FF8800","#ff8800","#F80", and"#f80"are equivalent.
Alternatively, you can specify some common colors by name. This table lists the named color options, the equivalent RGB triplets, and the hexadecimal color codes.
| Color Name | Short Name | RGB Triplet | Hexadecimal Color Code | Appearance |
|---|---|---|---|---|
"red" | "r" | [1 0 0] | "#FF0000" |
|
"green" | "g" | [0 1 0] | "#00FF00" |
|
"blue" | "b" | [0 0 1] | "#0000FF" |
|
"cyan"
| "c" | [0 1 1] | "#00FFFF" |
|
"magenta" | "m" | [1 0 1] | "#FF00FF" |
|
"yellow" | "y" | [1 1 0] | "#FFFF00" |
|
"black" | "k" | [0 0 0] | "#000000" |
|
"white" | "w" | [1 1 1] | "#FFFFFF" |
|
This table lists the default color palettes for plots in the light and dark themes.
| Palette | Palette Colors |
|---|---|
Before R2025a: Most plots use these colors by default. |
|
|
|
You can get the RGB triplets and hexadecimal color codes for these palettes using the
orderedcolors
and rgb2hex
functions. For example, get the RGB triplets for the "gem" palette and
convert them to hexadecimal color
codes.
RGB = orderedcolors("gem");
H = rgb2hex(RGB);
Example: StripeColor="r"
Example: StripeColor="green"
Example: StripeColor=[0 0.4470 0.7410]
Example: StripeColor="#00FFFF"
ROI visibility, specified as "on" or "off", or as
. A value of "on" is equivalent to
true, and "off" is equivalent to
false. The value is stored as an on/off logical value of type
OnOffSwitchState.
| Value | Description |
|---|---|
"on" | Display the ROI. |
"off" | Hide the ROI without deleting it. You can still access the properties of an invisible ROI. |
Labels
ROI label, specified as a character vector or string scalar. By default, the ROI has no label
('').
Transparency of the text background, specified as a number in the range [0, 1]. When
set to 1, the text background is completely opaque. When set to
0, the text background is completely transparent.
Label text color, specified as an RGB triplet, a hexadecimal color code, a color name, or a short color name.
For a custom color, specify an RGB triplet or a hexadecimal color code.
An RGB triplet is a three-element row vector whose elements specify the intensities of the red, green, and blue components of the color. The intensities must be in the range
[0,1], for example,[0.4 0.6 0.7].A hexadecimal color code is a string scalar or character vector that starts with a hash symbol (
#) followed by three or six hexadecimal digits, which can range from0toF. The values are not case sensitive. Therefore, the color codes"#FF8800","#ff8800","#F80", and"#f80"are equivalent.
Alternatively, you can specify some common colors by name. This table lists the named color options, the equivalent RGB triplets, and the hexadecimal color codes.
| Color Name | Short Name | RGB Triplet | Hexadecimal Color Code | Appearance |
|---|---|---|---|---|
"red" | "r" | [1 0 0] | "#FF0000" |
|
"green" | "g" | [0 1 0] | "#00FF00" |
|
"blue" | "b" | [0 0 1] | "#0000FF" |
|
"cyan"
| "c" | [0 1 1] | "#00FFFF" |
|
"magenta" | "m" | [1 0 1] | "#FF00FF" |
|
"yellow" | "y" | [1 1 0] | "#FFFF00" |
|
"black" | "k" | [0 0 0] | "#000000" |
|
"white" | "w" | [1 1 1] | "#FFFFFF" |
|
This table lists the default color palettes for plots in the light and dark themes.
| Palette | Palette Colors |
|---|---|
Before R2025a: Most plots use these colors by default. |
|
|
|
You can get the RGB triplets and hexadecimal color codes for these palettes using the
orderedcolors
and rgb2hex
functions. For example, get the RGB triplets for the "gem" palette and
convert them to hexadecimal color
codes.
RGB = orderedcolors("gem");
H = rgb2hex(RGB);
Example: LabelTextColor="r"
Example: LabelTextColor="green"
Example: LabelTextColor=[0 0.4470 0.7410]
Example: LabelTextColor="#00FFFF"
Label visibility, specified as one of these values.
| Value | Description |
|---|---|
"on" | Label is visible when the ROI is visible. |
"hover" | Label is visible only when the mouse is hovering over the ROI. |
"off" | Label is not visible. |
Interactivity
Context menu that displays when you right-click the ROI, specified as a
ContextMenu object. You can create a custom context menu by using
the uicontextmenu function and then
configuring context menu properties.
Context menu provides an option to delete the ROI, specified as . When the value is true, you can delete the ROI
interactively using the context menu. When the value is false, the
context menu option to delete the ROI is disabled.
In both cases, you can delete the ROI outside of the context menu by using the
delete function.
Area of the axes in which you can interactively place the ROI, specified as one of the values in this table.
| Value | Description |
|---|---|
"auto" | The drawing area is the current axes limits (default). |
"unlimited" | The drawing area has no boundary and ROIs can be drawn or dragged to extend beyond the axes limits. |
[x,y,w,h] | The drawing area is restricted to a rectangular region beginning at (x,y), and extending to width w and height h. |
Interactivity of the ROI, specified as one of the values in this table.
| Value | Description |
|---|---|
"all" | You can fully interact with the ROI. Reshape the ROI by changing the position of individual vertices, or move (translate) the entire ROI. |
"none" | You cannot interact with the ROI or access the context menu. No drag points are visible. |
"translate" | You can move the entire ROI within the drawing area. The relative position of vertices is fixed and you cannot reshape the ROI. |
"reshape" | You can reshape the ROI by changing the position of individual vertices. You cannot move the ROI. |
You can access the context menu for all values of
InteractionsAllowed except "none".
Selection state of the ROI, specified as "off" or
"on", or as . A value of "off" is equivalent to
false, and "on" is equivalent to
true.
You can also set this property interactively. For example, clicking on the ROI selects
the ROI and sets this property to true. Similarly, pressing the
Ctrl key and clicking the ROI deselects the ROI and sets the value
of this property to false.
Parent/Child
Visibility of the ROI handle in the Children property of the parent,
specified as one of the values in this table.
| Value | Description |
|---|---|
"on" | The object handle is always visible (default). |
"off" | The object handle is hidden at all times. |
"callback" | The object handle is visible from within callbacks or functions invoked by callbacks, but not from within functions invoked from the command line. |
ROI parent, specified as an Axes or UIAxes
object.
Identifiers
Tag to associate with the ROI, specified as a character vector or
string scalar. Use the tag value to find the ROI object in a
hierarchy of objects using the findobj
function.
Data to associate with the ROI, specified as any MATLAB data. For example, you can specify a scalar, vector, matrix, cell array,
string, character array, table, or structure. The Line object
does not use this data.
Object Functions
addlistener | Create event listener bound to event source |
beginDrawingFromPoint | Begin drawing ROI from specified point |
bringToFront | Bring ROI to front of Axes stacking order |
createMask | Create binary mask image from ROI |
draw | Begin drawing ROI interactively |
wait | Block MATLAB command line until ROI operation is finished |
Examples
Read an image into the workspace and display it.
I = imread("baby.jpg");
figure
imshow(I)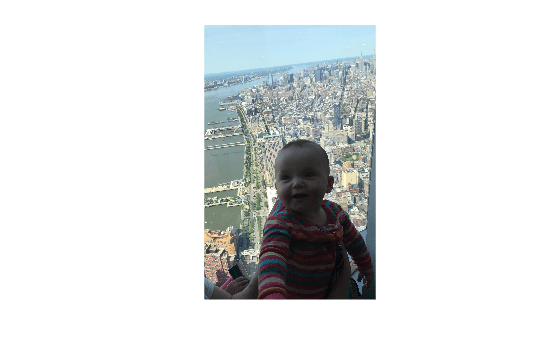
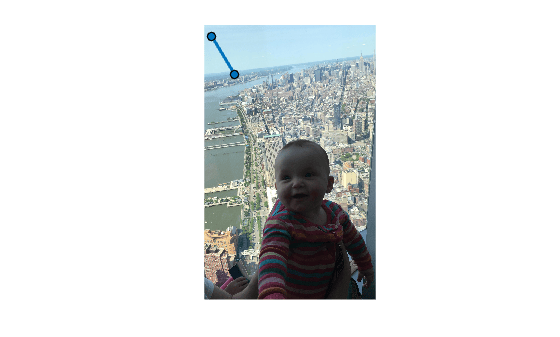
Create a linear ROI on the image, using the Position property to specify the ROI location. For programmatically created ROIs, if you want the ROI drawn in a specific axes, you must specify that axes as an input argument. Otherwise, an instance of the images.roi.Line class is created but not displayed. In this example, specify the current axes (gca) to draw the ROI on the image in that axes.
h = images.roi.Line(gca,Position=[100 150;400 650]);
Read an image into the workspace.
I = imread('cameraman.tif');Display the image.
imshow(I);
Draw a Line ROI on the image. Because this example specifies the length and location of the ROI, you do not have to call the draw method to enable interactive drawing.
roi = images.roi.Line(gca,'Position',[10 15; 200 15]);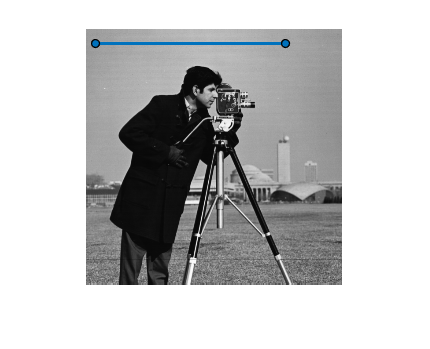
Set up listeners for ROI moving events. When you move it, the ROI sends notifications of these events and executes the callback function you specify.
addlistener(roi,'MovingROI',@allevents);
addlistener(roi,'ROIMoved',@allevents);
The allevents callback function displays at the command line the previous position and the current position of the ROI.
function allevents(src,evt)
evname = evt.EventName;
    switch(evname)
        case{'MovingROI'}
            disp(['ROI moving Previous Position: ' mat2str(evt.PreviousPosition)]);
            disp(['ROI moving Current Position: ' mat2str(evt.CurrentPosition)]);
        case{'ROIMoved'}
            disp(['ROI moved Previous Position: ' mat2str(evt.PreviousPosition)]);
            disp(['ROI moved Current Position: ' mat2str(evt.CurrentPosition)]);
    end
end
More About
Tips
To draw the ROI interactively using the
drawordrawlinefunction, position the cursor on the axes and click and drag to draw the ROI shape. To finish the ROI, release the mouse button.The ROI supports the following interactivity, including keyboard shortcuts.
Behavior Keyboard shortcut Make drawn line snap to 15 degree angles. Hold the Shift key while drawing. Cancel drawing the ROI. Press Esc. The function returns a valid ROI object with an empty Positionproperty.Resize the ROI. Position pointer over either endpoint and then click and drag to resize the ROI. Hold the Shift key while resizing to snap the line drawn at 15 degree angles.
Move the ROI. Position the pointer over the ROI. The pointer changes to the fleur shape. Then click and drag the ROI.

