Main Content

beginDrawingFromPoint

Begin drawing ROI from specified point

Description

example

beginDrawingFromPoint(ROI,[x y]) enters interactive mode to draw the shape for object ROI. The drawing starts at location (x,y) in the axes. This method is intended to be used within the ButtonDownFcn callback of an Image or Axes object.

beginDrawingFromPoint(ROI,[x y z]) enters interactive mode to draw a cuboidal ROI. The drawing starts at location (x,y,z) in the axes.

beginDrawingFromPoint(ROI,[x y z],s) enters interactive mode to draw a cuboidal ROI. The drawing starts at location (x,y,z) in the axes, snapping to the nearest location to the mouse from the Scatter object s.

beginDrawingFromPoint(ROI,[x y z],pos) enters interactive mode to draw a cuboidal ROI. The drawing starts at location (x,y,z) in the axes, snapping to the nearest location to the mouse from the position specified by pos.

Examples

collapse all

Create a new script called sampleDrawLine.m. Inside the script, copy and paste this code, then save the file.

hIm = imshow(imread('coins.png'));
hIm.ButtonDownFcn = @(~,~) buttonPressedCallback(hIm.Parent);
 
function buttonPressedCallback(hAx)
    cp = hAx.CurrentPoint;
    cp = [cp(1,1) cp(1,2)];
    obj = images.roi.Line('Parent',hAx,'Color',rand([1,3]));
    beginDrawingFromPoint(obj,cp);
end

Return to the MATLAB® command window. Run the script by entering the command:

sampleDrawLine

The code opens a figure window containing an image of coins. Each time you click the mouse over the figure, the script executes the callback function, buttonPressedCallback. The callback function begins drawing a new ROI starting from the pixel you clicked.

In the editor, open a file called cuboidExample.m. Copy and paste this code into the file and then save it.

function cuboidExample
    [x,y,z] = sphere(16);
    X = [x(:)*.5 x(:)*.75 x(:)];
    Y = [y(:)*.5 y(:)*.75 y(:)];
    Z = [z(:)*.5 z(:)*.75 z(:)];
    
    % Specify the size and color of each marker.
    S = repmat([1 .75 .5]*10,numel(x),1);
    C = repmat([1 2 3],numel(x),1);
    
    % Create a 3-D scatter plot
    figure
    hScatter = scatter3(X(:),Y(:),Z(:),S(:),C(:),'filled'); 
    view(-60,60);
 
    % Begin drawing cuboids when a scatter
    % point is clicked
    hScatter.ButtonDownFcn = @(~,~) buttonPressedCallback(hScatter.Parent);
   
    function buttonPressedCallback(hAx)
       cp = hAx.CurrentPoint;
       cp = cp(1,1:3);
       obj = images.roi.Cuboid('Parent',hAx,'Color',rand([1,3]));
       obj.beginDrawingFromPoint(cp);
    end
 end

Return to the MATLAB command window and run the function by entering the command:

cuboidExample

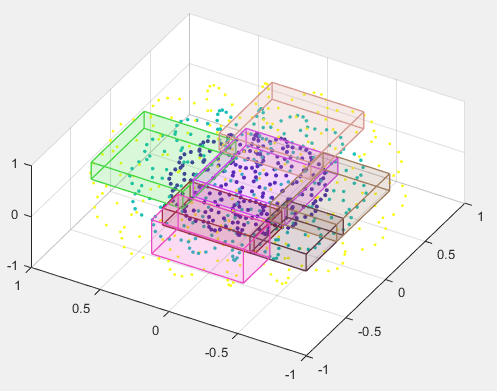
The code opens a figure window containing a scatter plot. Each time you click the mouse over the scatter plot, the function executes the callback function, buttonPressedCallback, and draws a new cuboidal ROI at the pixel you clicked.

3-D scatter plot with seven cuboidal ROIs of randomly selected colors.

Input Arguments

collapse all

Region of interest, specified as an ROI object of one of the following types:

Starting point in the axes, specified as a numeric array.

Starting point in 3-D axes, specified as a numeric array.

Scatter plot, specified as a matlab.graphics.chart.primitive.Scatter object.

Starting point in 3-D axes, specified as an N-by-3 numeric array. Each row in pos represents a 3-D spatial location of a potential placement position.

Version History

Introduced in R2018b