Statistik
RANG
111
of 302.006
REPUTATION
1.192
BEITRÄGE
0 Fragen
359 Antworten
ANTWORTZUSTIMMUNG
0.00%
ERHALTENE STIMMEN
230
RANG
2.859 of 21.488
REPUTATION
592
DURCHSCHNITTLICHE BEWERTUNG
4.40
BEITRÄGE
7 Dateien
DOWNLOADS
21
ALL TIME DOWNLOADS
5853
BEITRÄGE
0 Beiträge
BEITRÄGE
0 Öffentlich Kanäle
DURCHSCHNITTLICHE BEWERTUNG
BEITRÄGE
0 Discussions
DURCHSCHNITTLICHE ANZAHL DER LIKES


Feeds
ALT key activates toolstrip even if minimized (R2026a, release 2)
@Oliver: I apologize for the inconvenience. I was not aware of that issue when I suggested you upgrade to R2026a Update 2, but n...
etwa 2 Monate vor | 1
| akzeptiert
Keyboard shortcuts set to Windows upon first-time creation of a figure
@Oliver: This is a known bug that should be fixed in R2026a Update 1. I'm not aware of any workarounds to this issue other than ...
etwa 2 Monate vor | 2
| akzeptiert
Cannot stop warning from compassplot
The compass command supports two valid syntaxes: compassplot(theta, rho) compassplot(Z) - With this syntax, the angle(Z) is us...
7 Monate vor | 0
Sometimes heatmap does not display decimal values
@Peter Fraser: The text in the cells in a heatmap hide themselves automatically when they get "too small". If you don't specify ...
7 Monate vor | 0
.fig file places saved figure in a different position than that originally specified
Some questions: What release of MATLAB are you using? Do you see the same issue if you set the figure position to something mu...
8 Monate vor | 1
| akzeptiert
Legend not showing in MATLAB 2020b but works in 2023b
From your latest comments, it seems you have resolved the issue you were facing, but just to confirm. You asked: "Is there a di...
9 Monate vor | 0
| akzeptiert
Was java heap memory limited in MATLAB 2025b?
@Nick: Now that you've got an answer from technical support that it was a bug, let's talk potential solutions/workarounds. Have...
10 Monate vor | 1
UIAxes toolbar very slow just to turn off
There are two ways to "remove" the Axes Toolbar: You can set the Visibility off. Setting the Visibility of the axes toolbar req...
10 Monate vor | 1
| akzeptiert
I am using quiver3, arrow heads orientation
I'm not aware of an easy solution to this problem with quiver3, but you may want to look at coneplot, which draws 3D cones inste...
10 Monate vor | 0
In Matlab 2025a, how do I hide a plot trace
There are several options, but I think the closest to the plot browser is to use the Property Inspector: 1. Click on the "Forma...
10 Monate vor | 0
Matlab calculations randomly take forever to run, not represented in tic toc
@Nathan Thompson two questions: Do you have a figure open that contains a lot of data? Are you using linkdata? I've seen an i...
10 Monate vor | 0
Gesendet
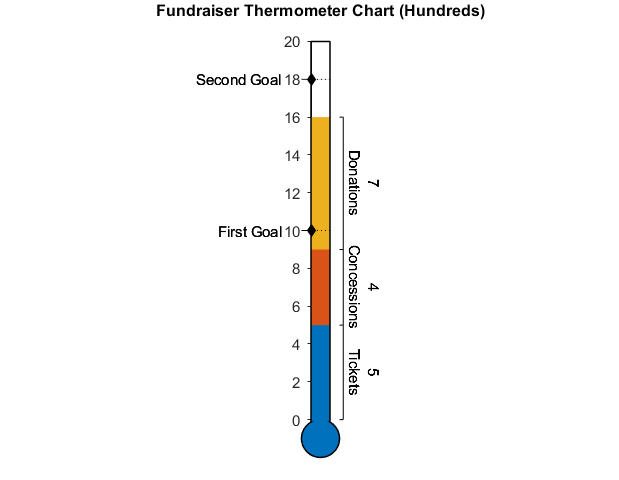
Thermometer Chart
Create a thermometer style chart with a stem, bulb, and desired labels.
11 Monate vor | 2 Downloads |
Plotting segments of a stacked bar chart to avoid duplicate legend entries
@Tim: You started by saying "It visaully works hole by hole but the legend duplicates according to the number of "objects" on th...
11 Monate vor | 0
How to prevent colors changing when appending new frames to a video
I'm not an exepert in MPEG-4 video compression, but my understanding is that MPEG-4 is a lossy video compression technology, so ...
etwa ein Jahr vor | 1
How do you match the width of figures in a tiledlayout when using axis equal?
Now that I've gone through the exercise of doing that using tiledlayout, I think I would suggest using neither tiledlayout nor s...
etwa ein Jahr vor | 1
| akzeptiert
How do you match the width of figures in a tiledlayout when using axis equal?
You can do this with tiledlayout, but it is not really what tiledlayout was designed to do. Part of the core of the layout algor...
etwa ein Jahr vor | 1
Change data contained in a binary .mat file
You can't view a MAT-file in the Variable Editor without first loading the contents into MATLAB, so if you are seeing the conten...
etwa ein Jahr vor | 1
How to plot a map in pole zone?
You can use mapaxes (part of the Mapping Toolbox) to plot at the north pole. Below is an example of how you could do this using...
etwa ein Jahr vor | 1
How to use figure(1) in MATLAB APP
I'm curious why you are calling figure(1)? I can think of three reasons you may be calling figure(1): You want to put the figu...
etwa ein Jahr vor | 0
How do install 2024b and not use 2025a?
The specific release(s) of MATLAB you can install/use depend on the specifics of your MATLAB license. You should check with the ...
etwa ein Jahr vor | 0
App designer : Saveas save all the interface and not just the figure mentionned
The saveas command is designed to save an entire figure to a special file-format (.fig) so that it can be opened again in MATLAB...
etwa ein Jahr vor | 0
Is Matlab 2021b still in support?
While MathWorks will do it's best to support old releases, there are some limitations due to changes in the underlying operating...
etwa ein Jahr vor | 0
autocomplete filenames paths function input
I don't think it is possible to do what you are requesting using an arguments block alone without also using functionSignatures....
etwa ein Jahr vor | 0
| akzeptiert
Revert the 2025 Editor taskbar icon
There is no preference to change this behavior. I will capture this feedback so we can look into changing this back in a future ...
etwa ein Jahr vor | 3
| akzeptiert
How can one switch between locations of same namespace in one file system?
If you have two folders on the path that both include the same namespace folders, their contents will be merged. If there are fi...
etwa ein Jahr vor | 1
| akzeptiert
A question about text string concatenation
The issue you are having is that Cruise_ID(Ind3) is a scalar string and not a character row vector. Concatenation works differe...
etwa ein Jahr vor | 1
plot 2D-function: x and y Range
While @Abhishek's solution is a fine solution, there is no restriction that the x and y input to the surf command are the output...
etwa ein Jahr vor | 0
Coloured circles on a mesh
What approach did you use to draw the rectangles? The easiest approach to drawing circles in MATLAB is using the rectangle comm...
etwa ein Jahr vor | 0
Assigning tstart to tic, when tic is a timer start function
As @Stephen23 said, if you have an app, storing the output from tic in a property on your app is a good approach. However, anoth...
etwa ein Jahr vor | 0
| akzeptiert
catch line using callback
The function that is called by the ButtonDownFcn has the line that you clicked on as an input argument. mycallback = @(o,~) set...
etwa ein Jahr vor | 0
| akzeptiert