Statistik
RANG
111
of 301.741
REPUTATION
1.178
BEITRÄGE
0 Fragen
357 Antworten
ANTWORTZUSTIMMUNG
0.00%
ERHALTENE STIMMEN
227
RANG
2.862 of 21.403
REPUTATION
590
DURCHSCHNITTLICHE BEWERTUNG
4.40
BEITRÄGE
7 Dateien
DOWNLOADS
23
ALL TIME DOWNLOADS
5829
BEITRÄGE
0 Beiträge
BEITRÄGE
0 Öffentlich Kanäle
DURCHSCHNITTLICHE BEWERTUNG
BEITRÄGE
0 Discussions
DURCHSCHNITTLICHE ANZAHL DER LIKES


Feeds
Gesendet
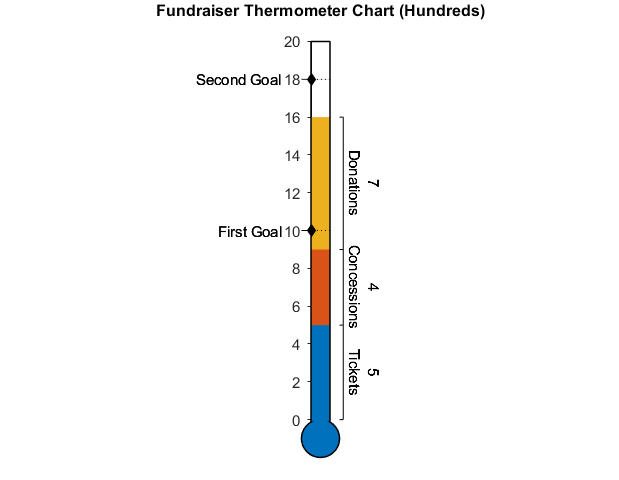
Thermometer Chart
Create a thermometer style chart with a stem, bulb, and desired labels.
9 Monate vor | 2 Downloads |
Gesendet
Sparklines Component
Create small graphs which show the general trend of data.
mehr als ein Jahr vor | 2 Downloads |

Gesendet
Spike Raster Plot
A spike raster plot from spike time stamps with optional trial and group data.
mehr als ein Jahr vor | 6 Downloads |

Gesendet
Color Trajectory Plot
A multi-color line based on a 2D trajectory with corresponding color data.
mehr als ein Jahr vor | 2 Downloads |

Gesendet
Venn Euler Diagram
Create a Venn/Euler diagram for sets which can be area-proportional.
mehr als 4 Jahre vor | 8 Downloads |

Gesendet
Confidence Interval Plot
Creates a chart with a mean line within a shaded confidence interval area.
mehr als 4 Jahre vor | 1 Download |

Gesendet
Continuous monitoring of wireless network of temperature sensors using MATLAB® and XBee®
Collect data from a network of temperature sensors using MATLAB® and XBee®.
mehr als 9 Jahre vor | 2 Downloads |
