Ergebnisse für
The Cody Contest 2025 is underway, and it includes a super creative problem group which many of us have found fascinating. The central theme of the problems, expertly curated by @Matt Tearle, humorously revolves around the whims of the capricious dictator Lord Ned, as he goes out of his way to complicate the lives of his subjects and visitors alike. We cannot judge whether or not there's any truth to the rumors behind all the inside jokes, but it's obvious that the team had a lot of fun creating these; and we had even more fun solving them.
Today I want to showcase a way of graphically solving and visualizing one of those problems which I found very elegant, The Bridges of Nedsburg.
To briefly reiterate the problem, the number of islands and the arrangement of bridges of the city of Nedsburg are constantly changing. Lord Ned has decided to take advantage of this by charging visitors with an increasingly expensive n-bridge pass which allows them to cross up to n bridges in one journey. Given the Connectivity Matrix C, we are tasked with calculating the minimum n needed so that there is a path from every island to every other island in n steps or fewer.
Matt kindly provided us with some useful bit of math in the description detailing how to calculate the way to get from one island to another in an number of m steps. However, he has also hidden an alternative path to the solution in plain sight, in one of the graphs he provided. This involves the extremely useful and versatile class digraph, representing directed graphs, which have directional edges connecting the nodes. Here's some further great documentation and other cool resources on the topic for those who are interested in learning more about it:
Let's start using this class to explore a graphical solution to Lord Ned's conundrum. We will use the unit tests included in the problem to visualize the solution. We can retrieve the connectivity matrix for each case using the following function:
function C = getConnectivityMatrix(unit_test)
% Number of islands and bridge arrangement
switch unit_test
case 1
m = 3; idx = [3;4;8];
case 2
m = 3; idx = [3;4;7;8];
case 3
m = 4; idx = [2;7;8;10;13];
case 4
m = 4; idx = [4;5;7;8;9;14];
case 5
m = 5; idx = [5;8;11;12;14;18;22;23];
case 6
m = 5; idx = [2;5;8;14;20;21;24];
case 7
m = 6; idx = [3;4;7;11;18;23;24;26;30;32];
case 8
m = 6; idx = [3;11;12;13;18;19;28;32];
case 9
m = 7; idx = [3;4;6;8;13;14;20;21;23;31;36;47];
case 10
m = 7; idx = [4;11;13;14;19;22;23;26;28;30;34;35;37;38;45];
case 11
m = 8; idx = [2;4;5;6;8;12;13;17;27;39;44;48;54;58;60;62];
case 12
m = 8; idx = [3;9;12;20;24;29;30;31;33;44;48;50;53;54;58];
case 13
m = 9; idx = [8;9;10;14;15;22;25;26;29;33;36;42;44;47;48;50;53;54;55;67;80];
case 14
m = 9; idx = [8;10;22;32;37;40;43;45;47;53;56;57;62;64;69;70;73;77;79];
case 15
m = 10; idx = [2;5;8;13;16;20;24;27;28;36;43;49;53;62;71;75;77;83;86;87;95];
case 16
m = 10; idx = [4;9;14;21;22;35;37;38;44;47;50;51;53;55;59;61;63;66;69;76;77;84;85;86;90;97];
end
C = zeros(m);
C(idx) = 1;
end
The case in the example refers to unit test case 2.
unit_test = 2;
C = getConnectivityMatrix(unit_test);
disp(C)
D = digraph(C);
figure
p = plot(D,'LineWidth',1.5,'ArrowSize',10);
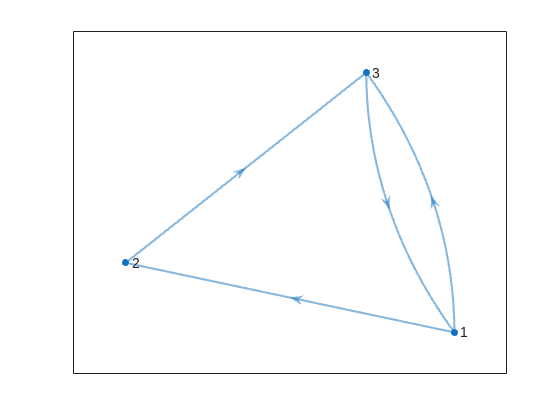
This is the same as the graph provided in the example. Another very useful method of digraph is shortestpath. This allows us to calculate the path and distance from one single node to another. For example:
% Path and distance from node 1 to node 2
[path12,dist12] = shortestpath(D,1,2);
fprintf('The shortest path from island %d to island %d is: %s. The minimum number of steps is: n = %d\n', 1, 2, join(string(path12), ' -> '),dist12)
% Path and distance from node 2 to node 1
[path21,dist21] = shortestpath(D,2,1);
fprintf('The shortest path from island %d to island %d is: %s. The minimum number of steps is: n = %d\n', 2, 1, join(string(path21), ' -> '),dist21)
figure
p = plot(D,'LineWidth',1.5,'ArrowSize',10);
highlight(p,path12,'EdgeColor','r','NodeColor','r','LineWidth',2)
highlight(p,path21,'EdgeColor',[0 0.8 0],'LineWidth',2)

But that's not all! digraph can also provide us with a matrix of the distances d, i.e. the steps needed to travel from island i to island j, where i and j are the rows and columns of d respectively. This is accomplished by using its distances method. The distance matrix can be visualized as:
d = distances(D);
figure
% Using pcolor w/ appending matrix workaround for convenience
pcolor([d,d(:,end);d(end,:),d(end,end)])
% Alternatively you can use imagesc(d), but you'll have to recreate the grid manually
axis square
set(gca,'YDir','reverse','XTick',[],'YTick',[])
[X,Y] = meshgrid(1:height(d));
text(X(:)+0.5,Y(:)+0.5,string(d(:)),'FontSize',11)
colormap(interp1(linspace(0,1,4), [1 1 1; 0.7 0.9 1; 0.6 0.7 1; 1 0.3 0.3], linspace(0,1,8)))
clim([-0.5 7+0.5])
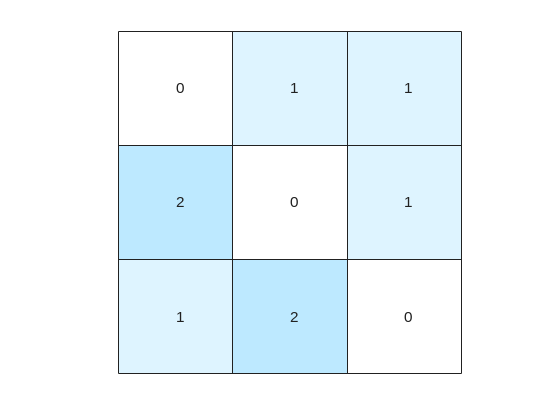
This confirms what we saw before, i.e. you need 1 step to go from island 1 to island 2, but 2 steps for vice versa. It also confirms that the minimum number of steps n that you need to buy the pass for is 2 (which also occurs for traveling from island 3 to island 2). As it's not the point of the post to give the full solution to the problem but rather present the graphical way of visualizing it I will not include the code of how to calculate this, but I'm sure that by now it's reduced to a trivial problem which you have already figured out how to solve.
That being said, now that we have the distance matrix, let's continue with the visualizations. First, let's plot the corresponding paths for each of these combinations:
figure
tiledlayout(size(C,1),size(C,2),'TileSpacing','tight','Padding','tight');
for i = 1:size(C,1)
for j = 1:size(C,2)
nexttile
p = plot(D,'ArrowSize',10);
highlight(p,shortestpath(D,i,j),'EdgeColor','r','NodeColor','r','LineWidth',2)
lims = axis;
text(lims(1)+diff(lims(1:2))*0.05,lims(3)+diff(lims(3:4))*0.9,sprintf('n = %d',d(i,j)))
end
end

This allows us to go from the distance matrix to visualizing the paths and number of steps for each corresponding case. Things are rather simple for this 3-island example case, but evil Lord Ned is just getting started. Let's now try to solve the problem for all provided unit test cases:
% Cell array of connectivity matrices
C = arrayfun(@getConnectivityMatrix,1:16,'UniformOutput',false);
% Cell array of corresponding digraph objects
D = cellfun(@digraph,C,'UniformOutput',false);
% Cell array of corresponding distance matrices
d = cellfun(@distances,D,'UniformOutput',false);
% id of solutions: Provided as is to avoid handing out the code to the full solution
id = [2, 2, 9, 3, 4, 6, 16, 4, 44, 43, 33, 34, 7, 18, 39, 2];
First, let's plot the distance matrix for each case:
figure
tiledlayout('flow','TileSpacing','compact','Padding','compact');
% Vary this to plot different combinations of cases
plot_cases = 1:numel(C);
for i = plot_cases
nexttile
pcolor([d{i},d{i}(:,end);d{i}(end,:),d{i}(end,end)])
axis square
set(gca,'YDir','reverse','XTick',[],'YTick',[])
title(sprintf('Case %d',i),'FontWeight','normal','FontSize',8)
end
c = colorbar('Ticks',0:7,'TickLength',0,'Limits',[-0.5 7+0.5],'FontSize',8);
c.Layout.Tile = 'East';
c.Label.String = 'Number of Steps';
c.Label.FontSize = 8;
colormap(interp1(linspace(0,1,4), [1 1 1; 0.7 0.9 1; 0.6 0.7 1; 1 0.3 0.3], linspace(0,1,8)))
clim(findobj(gcf,'type','axes'),[-0.5 7+0.5])
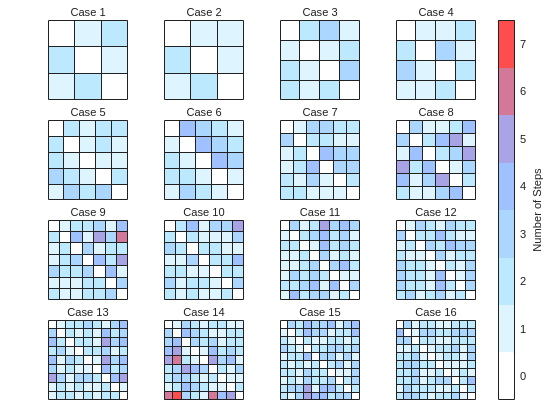
We immediately notice some inconsistencies, perhaps to be expected of the eccentric and cunning dictator. Things are pretty simple for the configurations with a small number of islands, but the minimum number of steps n can increase sharply and disproportionally to the additional number of islands. Cases 8 and 9 specifically have a particularly large n (relative to their grid dimensions), and case 14 has the largest n, almost double that of case 16 despite the fact that the latter has one extra island.
To visualize how this is possible, let's plot the path corresponding to the largest n for each case (though note that there might be multiple possible paths for each case):
figure
tiledlayout('flow','TileSpacing','tight','Padding','tight');
for i = plot_cases
nexttile
% Changing the layout to circular so we can better visualize the paths
p = plot(D{i},'ArrowSize',10,'Layout','Circle');
% Alternatively we could use the XData and YData properties if the positions of the islands were provided
axis([-1.5 1.5 -1.5 1.75])
[row,col] = ind2sub(size(d{i}),id(i));
highlight(p,shortestpath(D{i},row,col),'EdgeColor','r','NodeColor','r','LineWidth',2)
lims = axis;
text(lims(1)+diff(lims(1:2))*0.05,lims(3)+diff(lims(3:4))*0.9,sprintf('n = %d',d{i}(row,col)))
end
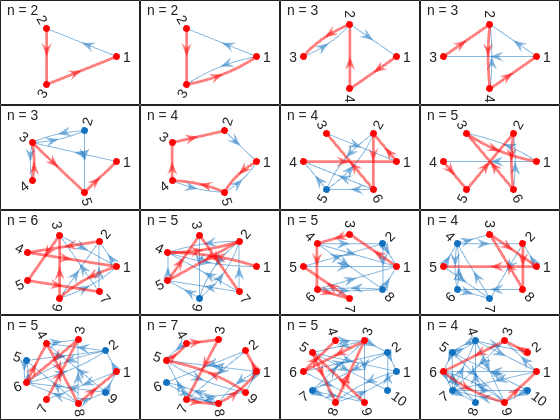
And busted! Unraveled! Exposed! Lord Ned has clearly been taking advantages of the tectonic forces by instructing his corrupt civil engineer lackeys to design the bridges to purposely force the visitors to go around in circles in order to drain them of their precious savings. In particular, for cases 8 and 9, he would have them go through every single island just to get from one island to another, whereas for case 14 they would have to visit 8 of the 9 islands just to get to their destination. If that's not diabolical then I don't know what is!
Ned jokes aside, I hope you enjoyed this contest just as much as I did, and that you found this article useful. I look forward to seeing more creative problems and solutions in the future.
I am Prof Ansar Interested in coding challenge taker inmatlab
Run MATLAB using AI applications by leveraging MCP. This MCP server for MATLAB supports a wide range of coding agents like Claude Code and Visual Studio Code.
Check it out and share your experiences below. Have fun!
GitHub repo: https://github.com/matlab/matlab-mcp-core-server
Yann Debray's blog post: https://blogs.mathworks.com/deep-learning/2025/11/03/releasing-the-matlab-mcp-core-server-on-github/
Pick a team, solve Cody problems, and share your best tips and tricks. Whether you’re a beginner or a seasoned MATLAB user, you’ll have fun learning, connecting with others, and competing for amazing prizes, including MathWorks swags, Amazon gift cards, and virtual badges.
How to Participate
- Join a team that matches your coding personality
- Solve Cody problems, complete the contest problem group, or share Tips & Tricks articles
- Bonus Round: Two top players from each team will be invited to a fun code-along event
Contest Timeline
- Main Round: Nov 10 – Dec 7, 2025
- Bonus Round: Dec 8 – Dec 19, 2025
Prizes (updated 11/19)
- (New prize) Solving just one problem in the contest problem group gives you a chance to win MathWorks T-shirts or socks each week.
- Finishing the entire problem group will greatly increase your chances—while helping your team win.
- Share high-quality Tips & Tricks articles to earn you a coveted MathWorks Yeti Bottle.
- Become a top finisher in your team to win Amazon gift cards and an invitation to the bonus round.

Hey Creative Coders! 😎
Let’s get to know each other. Drop a quick intro below and meet your teammates! This is your chance to meet teammates, find coding buddies, and build connections that make the contest more fun and rewarding!
You can share:
- Your name or nickname
- Where you’re from
- Your favorite coding topic or language
- What you’re most excited about in the contest
Let’s make Team Creative Coders an awesome community—jump in and say hi! 🚀
Welcome to the Cody Contest 2025 and the Creative Coders team channel! 🎉
You think outside the box. Where others see limitations, you see opportunities for innovation. This is your space to connect with like-minded coders, share insights, and help your team win. To make sure everyone has a great experience, please keep these tips in mind:
- Follow the Community Guidelines: Take a moment to review our community standards. Posts that don’t follow these guidelines may be flagged by moderators or community members.
- Ask Questions About Cody Problems: When asking for help, show your work! Include your code, error messages, and any details needed to reproduce your results. This helps others provide useful, targeted answers.
- Share Tips & Tricks: Knowledge sharing is key to success. When posting tips or solutions, explain how and why your approach works so others can learn your problem-solving methods.
- Provide Feedback: We value your feedback! Use this channel to report issues or share creative ideas to make the contest even better.
Have fun and enjoy the challenge! We hope you’ll learn new MATLAB skills, make great connections, and win amazing prizes! 🚀
For the www, uk, and in domains,a generative search answer is available for Help Center searches. Please let us know if you get good or bad results for your searches. Some have pointed out that it is not available in non-english domains. You can switch your country setting to try it out. You can also ask questions in different languages and ask for the response in a different language. I get better results when I ask more specific queries. How is it working for you?
Hello MATLAB Central community,
My name is Yann. And I love MATLAB. I also love Python ... 🐍 (I know, not the place for that).
I recently decided to go down the rabbit hole of AI. So I started benchmarking deep learning frameworks on basic examples. Here is a recording of my experiment:
Happy to engage in the debate. What do you think?
Large Language Models (LLMs) with MATLAB was updated again today to support the newly released OpenAI models GPT-5, GPT-5 mini, GPT-5 nano, GPT-5 chat, o3, and o4-mini. When you create an openAIChat object, set the ModelName name-value argument to "gpt-5", "gpt-5-mini", "gpt-5-nano", "gpt-5-chat-latest", "o4-mini", or "o3".
This is version 4.4.0 of this free MATLAB add-on that lets you interact with LLMs on MATLAB. The release notes are at Release v4.4.0: Support for GPT-5, o3, o4-mini · matlab-deep-learning/llms-with-matlab
The Graphics and App Building Blog just launched its first article on R2025a features, authored by Chris Portal, the director of engineering for the MATLAB graphics and app building teams.
Over the next few months, we'll publish a series of articles that showcase our updated graphics system, introduce new tools and features, and provide valuable references enriched by the perspectives of those involved in their development.
To stay updated, you can subscribe to the blog (look for the option in the upper left corner of the blog page). We also encourage you to join the conversation—your comments and questions under each article help shape the discussion and guide future content.
Large Languge model with MATLAB, a free add-on that lets you access LLMs from OpenAI, Azure, amd Ollama (to use local models) on MATLAB, has been updated to support OpenAI GPT-4.1, GPT-4.1 mini, and GPT-4.1 nano.
According to OpenAI, "These models outperform GPT‑4o and GPT‑4o mini across the board, with major gains in coding and instruction following. They also have larger context windows—supporting up to 1 million tokens of context—and are able to better use that context with improved long-context comprehension."
What would you build with the latest update?

Provide insightful answers
9%
Provide label-AI answer
9%
Provide answer by both AI and human
21%
Do not use AI for answers
46%
Give a button "chat with copilot"
10%
use AI to draft better qustions
5%
1561 Stimmen
%% 清理环境
close all; clear; clc;
%% 模拟时间序列
t = linspace(0,12,200); % 时间从 0 到 12,分 200 个点
% 下面构造一些模拟的"峰状"数据,用于演示
% 你可以根据需要替换成自己的真实数据
rng(0); % 固定随机种子,方便复现
baseIntensity = -20; % 强度基线(z 轴的最低值)
numSamples = 5; % 样本数量
yOffsets = linspace(20,140,numSamples); % 不同样本在 y 轴上的偏移
colors = [ ...
0.8 0.2 0.2; % 红
0.2 0.8 0.2; % 绿
0.2 0.2 0.8; % 蓝
0.9 0.7 0.2; % 金黄
0.6 0.4 0.7]; % 紫
% 构造一些带多个峰的模拟数据
dataMatrix = zeros(numSamples, length(t));
for i = 1:numSamples
% 随机峰参数
peakPositions = randperm(length(t),3); % 三个峰位置
intensities = zeros(size(t));
for pk = 1:3
center = peakPositions(pk);
width = 10 + 10*rand; % 峰宽
height = 100 + 50*rand; % 峰高
% 高斯峰
intensities = intensities + height*exp(-((1:length(t))-center).^2/(2*width^2));
end
% 再加一些小随机扰动
intensities = intensities + 10*randn(size(t));
dataMatrix(i,:) = intensities;
end
%% 开始绘图
figure('Color','w','Position',[100 100 800 600],'Theme','light');
hold on; box on; grid on;
for i = 1:numSamples
% 构造 fill3 的多边形顶点
xPatch = [t, fliplr(t)];
yPatch = [yOffsets(i)*ones(size(t)), fliplr(yOffsets(i)*ones(size(t)))];
zPatch = [dataMatrix(i,:), baseIntensity*ones(size(t))];
% 使用 fill3 填充面积
hFill = fill3(xPatch, yPatch, zPatch, colors(i,:));
set(hFill,'FaceAlpha',0.8,'EdgeColor','none'); % 调整透明度、去除边框
% 在每条曲线尾部标注 Sample i
text(t(end)+0.3, yOffsets(i), dataMatrix(i,end), ...
['Sample ' num2str(i)], 'FontSize',10, ...
'HorizontalAlignment','left','VerticalAlignment','middle');
end
%% 坐标轴与视角设置
xlim([0 12]);
ylim([0 160]);
zlim([-20 350]);
xlabel('Time (sec)','FontWeight','bold');
ylabel('Frequency (Hz)','FontWeight','bold');
zlabel('Intensity','FontWeight','bold');
% 设置刻度(根据需要微调)
set(gca,'XTick',0:2:12, ...
'YTick',0:40:160, ...
'ZTick',-20:40:200);
% 设置视角(az = 水平旋转,el = 垂直旋转)
view([211 21]);
% 让三维坐标轴在后方
set(gca,'Projection','perspective');
% 如果想去掉默认的坐标轴线,也可以尝试
% set(gca,'BoxStyle','full','LineWidth',1.2);
%% 可选:在后方添加一个浅色网格平面 (示例)
% 这个与题图右上方的网格类似
[Xplane,Yplane] = meshgrid([0 12],[0 160]);
Zplane = baseIntensity*ones(size(Xplane)); % 在 Z = -20 处画一个竖直面的框
surf(Xplane, Yplane, Zplane, ...
'FaceColor',[0.95 0.95 0.9], ...
'EdgeColor','k','FaceAlpha',0.3);
%% 进一步美化(可根据需求调整)
title('3D Stacked Plot Example','FontSize',12);
constantplane("x",12,FaceColor=rand(1,3),FaceAlpha=0.5);
constantplane("y",0,FaceColor=rand(1,3),FaceAlpha=0.5);
constantplane("z",-19,FaceColor=rand(1,3),FaceAlpha=0.5);
hold off;

Have fun! Enjoy yourself!
Hello Community,
We're excited to announce that registration is now open for the MathWorks AUTOMOTIVE CONFERENCE 2025! This event presents a fantastic opportunity to connect with MathWorks and industry experts while exploring the latest trends in the automotive sector.
Event Details:
- Date: April 29, 2025
- Location: St. John’s Resort, Plymouth, MI
Featured Topics:
- Virtual Development
- Electrification
- Software Development
- AI in Engineering
Whether you're a professional in the automotive industry or simply interested in these cutting-edge topics, we highly encourage you to register for this conference.
We look forward to seeing you there!
We are excited to announce another update to our Discussions area: the new Contribution Widget! The new widget simplifies the process of creating diverse types of content, whether you're praising someone who has helped you, sharing tips and tricks, or polling the community.

Previously, creating various types of content required navigating multiple links or channels. With the new Contribution Widget, everything you need is conveniently located in one place.
Give it a try and let us know how we can further enhance your user experience.
P.S. Who has been particularly helpful to you lately? Create your first praise post and let them know!
We are excited to announce the first edition of the MathWorks AI Challenge. You’re invited to submit innovative solutions to challenges in the field of artificial intelligence. Choose a project from our curated list and submit your solution for a chance to win up to $1,000 (USD). Showcase your creativity and contribute to the advancement of AI technology.
Creating data visualizations
79%
Interpreting data visualizations
21%
28 Stimmen
Have you ever wanted to search for a community member but didn't know where to start? Or perhaps you knew where to search but couldn't find enough information from the results? You're not alone. Many community users have shared this frustration with us. That's why the community team is excited to introduce the new ‘People’ page to address this need.

What Does the ‘People’ Page Offer?
- Comprehensive User Search: Search for users across different applications seamlessly.
- Detailed User Information: View a list of community members along with additional details such as their join date, rankings, and total contributions.
- Sorting Options: Use the ‘sort by’ filter located below the search bar to organize the list according to your preferences.
- Easy Navigation: Access the Answers, File Exchange, and Cody Leaderboard by clicking the ‘Leaderboards’ button in the upper right corner.
In summary, the ‘People’ page provides a gateway to search for individuals and gain deeper insights into the community.
How Can You Access It?
Navigate to the global menu, click on the ‘More’ link, and you’ll find the ‘People’ option.
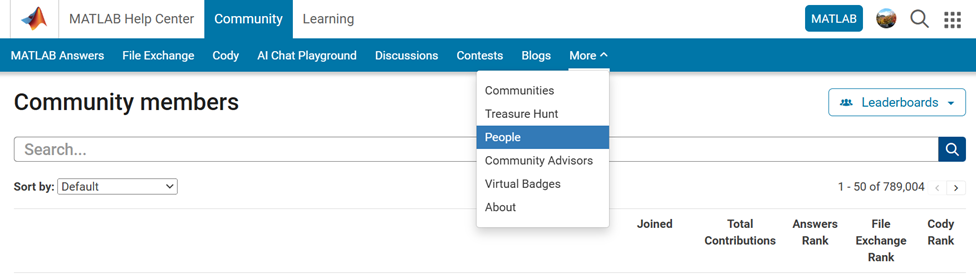
Now you know where to go if you want to search for a user. We encourage you to give it a try and share your feedback with us.
Simulink has been an essential tool for modeling and simulating dynamic systems in MATLAB. With the continuous advancements in AI, automation, and real-time simulation, I’m curious about what the future holds for Simulink.
What improvements or new features do you think Simulink will have in the coming years? Will AI-driven modeling, cloud-based simulation, or improved hardware integration shape the next generation of Simulink?
You've probably heard about the DeepSeek AI models by now. Did you know you can run them on your own machine (assuming its powerful enough) and interact with them on MATLAB?
In my latest blog post, I install and run one of the smaller models and start playing with it using MATLAB.
Larger models wouldn't be any different to use assuming you have a big enough machine...and for the largest models you'll need a HUGE machine!
Even tiny models, like the 1.5 billion parameter one I demonstrate in the blog post, can be used to demonstrate and teach things about LLM-based technologies.
Have a play. Let me know what you think.