sldvextract
Extract subsystem or subchart contents into new model for analysis
Syntax
Description
newModel = sldvextract(subsystem)subsystem and
creates a model for the Simulink®
Design Verifier™ software to analyze. sldvextract returns the name
of the new model in newModel. If the model name exists,
sldvextract uses the subsystem name for the model name,
appending a number to the model name.
newModel = sldvextract(subchart)subchart and
creates a model for the Simulink
Design Verifier software to analyze. Specify the full path of the atomic subchart in
subchart. If the model name exists,
sldvextract uses the subchart name for the model name,
appending a number to the model name.
Note
If the atomic subchart calls an exported graphical function that is
outside the subchart, sldvextract creates the model, but
the new model will not compile.
newModel = sldvextract(exportfcnmodel)exportfcnmodel for analysis by Simulink
Design Verifier. sldvextract returns the name of the new model in
newModel. The newModel consists of
exportfcnmodel model name with a suffix
SldvScheduler. If the model name already exists,
sldvextract uses the exportfcnmodel
name for the model name, appending a number to the model name.
newModel = sldvextract(modelmissingslfunctiondef)modelmissingslfunctiondef
which has missing Simulink function definitions for the Simulink
Design Verifier to analyze. It returns the name of the new model in
newModel. sldvextract uses the input
model name with a suffix SldvStub for the extracted model name,
appending a numeral to the model name if that model name already exists.
newModel = sldvextract(modelmissingslfunctiondef, showModel)showModel to
true. Extracted model will be only loaded if
showModel is set to false.
Examples
Extract the atomic subsystem Bus Counter from the
sldemo_mdlref_conversion model and copy it to a new
model.
openExample('sldemo_mdlref_conversion');
newmodel = sldvextract('sldemo_mdlref_conversion/Bus Counter', true);
Extract the atomic subchart Sensor1 from the
sf_atomic_sensor_pair model and copy it to a new
model.
openExample('sf_atomic_sensor_pair');
newmodel = sldvextract('sf_atomic_sensor_pair/RedundantSensors/Sensor1',...
		true);
This example shows how you can analyze a model which consists of periodic function-call subsystems. This example uses the AUTOSAR example model sldvExportFunction_autosar_multirunnables.
1. Open the sldvExportFunction_autosar_multirunnables model.
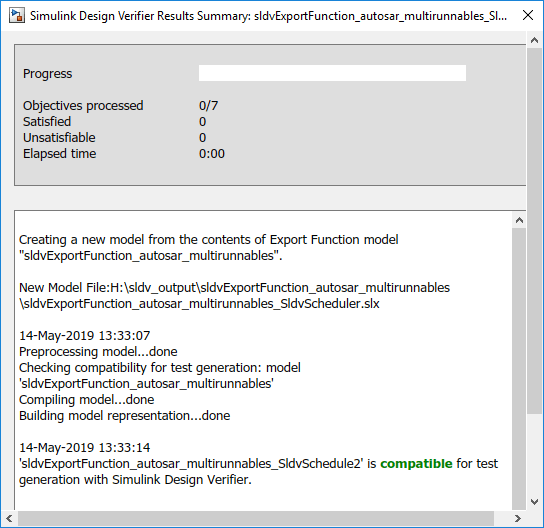
open_system('sldvExportFunction_autosar_multirunnables');2. To run the test generation analysis, on the Design Verifier tab, click Generate Tests.
The Simulink Design Verifier Results Summary window indicates that a scheduler model sldvExportFunction_autosar_multirunnables_SldvScheduler.slx is created. You can also generate a scheduler model by using sldvextract.
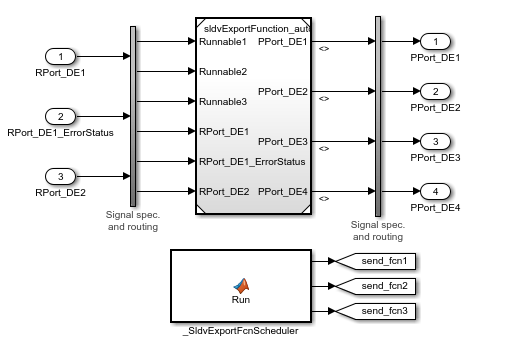
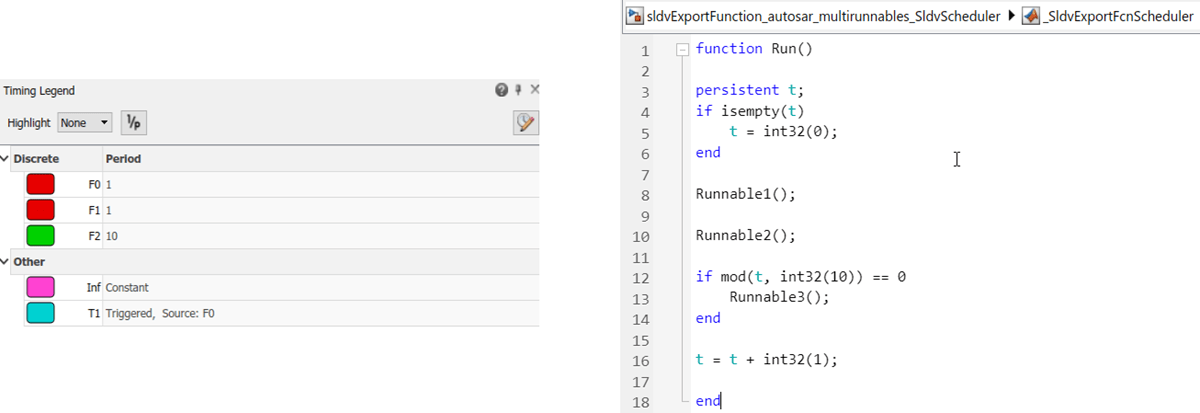
The scheduler model consists of a MATLAB® function block _SldvExportFcnScheduler. The function calls are called periodically as the model consists of periodic function-call subsystem.
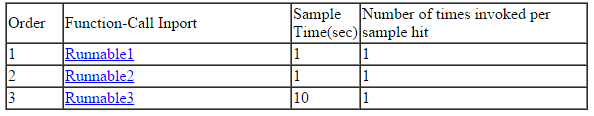
The MATLAB® code specifies the order in which the periodic function-call execute. Runnable1 and Runnable2 executes first because the time period is 1 for both of them. After 10 time steps, Runnable3 executes.
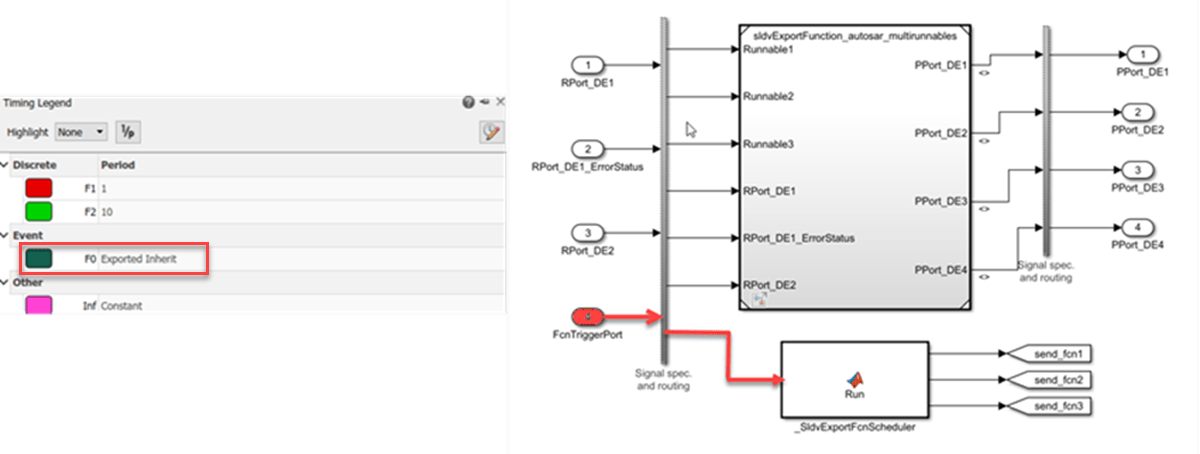
If the model consists of aperiodic function-call subsystems, the scheduler consists of an additional inport FcnTriggerPort. The value of FcnTriggerPort indicates whether to invoke the function-call in a time step.
For example, if Runnable1 is an aperiodic function-call subsystem, the FcnTriggerPort Inport block invokes the scheduler model. This graphic shows the Timing Legend window and the scheduler model for an aperiodic function-call.
After the test generation analysis, in the Simulink Design Verifier Results Summary window, you see the results that 7/7 objectives are Satisfied.
3. To simulate the test cases and generate a coverage report, click Simulate tests and produce a model coverage report in the Simulink Design Verifier Results Summary window. The software simulates the test cases, collects model coverage information, and displays a coverage report.
4. To view the detailed analysis report, click HTML in the Simulink Design Verifier Results Summary window.
The Schedule for Export Function Analysis section in the Analysis Information chapter lists the schedule for invoking the export functions.
Input Arguments
Output Arguments
Limitations
Simulink Design Verifier does not support extraction when:
A subsystem has reinitialize ports. For more information, see Reinitialize States of Blocks in Subsystem.
A model block has Initialize, Reset, Reinitialize, or Terminate event ports. For more information, see model event simulation in the Model block.
Version History
Introduced in R2007a