Main Content

setLabelValue

Set label value in labeled signal set

Description

setLabelValue(lss,midx,lblName,val) sets the attribute label lblName to value val, for the member of labeled signal set lss specified in midx. Omit val if lblName has a default value and you want to set the label to the default value.

example

setLabelValue(lss,midx,lblName,locs,val) adds points to the point label named lblName. locs specifies the number of added points and their locations.

setLabelValue(lss,midx,lblName,tLimits,val) adds regions delimited by time limits tLimits to the ROI label named lblName. The number of rows of tLimits specifies the number of added regions.

setLabelValue(lss,midx,lblName,tLimits,fLimits,val) adds regions delimited by time limits and frequency limits tLimits and fLimits to the time-frequency ROI label named lblName. tLimits and fLimits must have the same number of rows, where this common number specifies the number of added regions.

setLabelValue(___,'LabelRowIndex',ridx) specifies the row index, ridx, of an ROI or point label. The specified value replaces the current value of that row. If you omit this argument, the function appends ROI or point values to any existing label values.

setLabelValue(___,'SublabelRowIndex',sridx) specifies the row index, sridx, of an ROI or point sublabel. The specified value replaces the current value of that sublabel row.
Examples

collapse all

Load a labeled signal set containing recordings of whale songs.

load whales
lss
lss = 
  labeledSignalSet with properties:

             Source: {2×1 cell}
         NumMembers: 2
    TimeInformation: "sampleRate"
         SampleRate: 4000
             Labels: [2×3 table]
        Description: "Characterize wave song regions"

 Use labelDefinitionsHierarchy to see a list of labels and sublabels.
 Use setLabelValue to add data to the set.

Add a new label to the signal set, corresponding to the maximum value of each member.

theMax = signalLabelDefinition('Maximum', ...
    'LabelDataType','numeric', ...
    'Description','Maximum value of the signal');
addLabelDefinitions(lss,theMax)

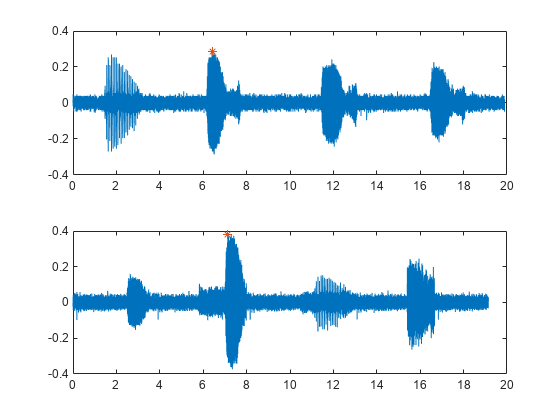
For each labeled signal, set the value of the new label to the signal maximum. Plot the signals and their maxima.

fs = lss.SampleRate;
for k = 1:lss.NumMembers
    sg = getSignal(lss,k);
    [mx,ix] = max(sg);
    
    setLabelValue(lss,k,'Maximum',mx)
    
    subplot(2,1,k)
    plot((0:length(sg)-1)/fs,sg,ix/fs,mx,'*')
end

Figure contains 2 axes objects. Axes object 1 contains 2 objects of type line. One or more of the lines displays its values using only markers Axes object 2 contains 2 objects of type line. One or more of the lines displays its values using only markers

Display the names and values of the labels in the set.

lbldefs = getLabelValues(lss)
lbldefs=2×4 table
                 WhaleType    MoanRegions    TrillRegions     Maximum  
                 _________    ___________    ____________    __________

    Member{1}      blue       {3×2 table}    {1×3 table}     {[0.2850]}
    Member{2}      blue       {3×2 table}    {1×3 table}     {[0.3791]}

Decide that the signal maximum is better represented as a point label than as an attribute. Remove the numeric definition and redefine the maximum.

removeLabelDefinition(lss,'Maximum')
theMax = signalLabelDefinition('Maximum', ...
    'LabelType','point','LabelDataType','numeric', ...
    'Description','Maximum value of the signal');
addLabelDefinitions(lss,theMax)

For each labeled signal, set the value of the new label to the signal maximum.

for k = 1:lss.NumMembers
    sg = getSignal(lss,k);
    [mx,ix] = max(sg);
    setLabelValue(lss,k,'Maximum',ix/fs,mx)
end

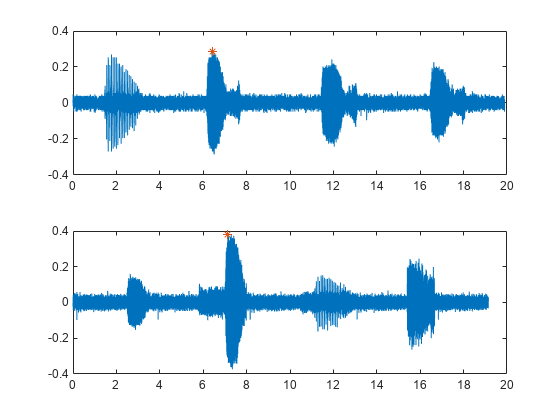
Plot the signals and their maxima.

for k = 1:lss.NumMembers
    subplot(2,1,k)
    sg = getSignal(lss,k);
    peaks = getLabelValues(lss,k,'Maximum');
    plot((0:length(sg)-1)/fs,sg, ...
        peaks.Location,cell2mat(peaks.Value),'*')
end

Figure contains 2 axes objects. Axes object 1 contains 2 objects of type line. One or more of the lines displays its values using only markers Axes object 2 contains 2 objects of type line. One or more of the lines displays its values using only markers

Since R2025a

Label Gaussian atoms in the time-frequency domain using a time-frequency region-of-interest (ROI) label definition and spectrogram options.

Generate Signal and Visualize Spectrogram

Generate a signal that consists of a voltage-controlled oscillator and four Gaussian atoms. The signal is sampled at 14 kHz for two seconds. Plot the spectrogram of the signal.

Fs = 14000;
t = (0:1/Fs:2)';
st = 0.01;
gaussFun = @(A,x,mu,f) exp(-(x-mu).^2/(2*st^2)).*sin(2*pi*f.*x)*A';
atomTimeCenters = [0.2 0.5 1 1.75];
atomFreqCenters = [2 6 2 5]*1000;
s = gaussFun([1 1 1 1]/10,t,atomTimeCenters,atomFreqCenters);
x = vco(chirp(t+.1,0,t(end),3).*exp(-2*(t-1).^2),[0.1 0.4]*Fs,Fs);
s = s/10+x;

bt = 0.2;
tr = 0.05;
op = 99;
pspectrum(s,Fs,"spectrogram", ...
    Leakage=bt,TimeResolution=tr,OverlapPercent=op)

Figure contains an axes object. The axes object with title Fres = 64.5333 Hz, Tres = 50 ms, xlabel Time (s), ylabel Frequency (kHz) contains an object of type image.

The spectrogram shows four patches in time-frequency domain that correspond with the Gaussian atoms. Define the times and frequencies for all the atoms.

atomTimes = atomTimeCenters'+[-st st]*5.5;
atomFreqs = atomFreqCenters'+[-1 1]*200;

Label Signal in Time-Frequency Domain

Create a logical time-frequency ROI label definition to label the Gaussian atoms. Specify spectrogram options with leakage properties.

opts = labelSpectrogramOptions("leakage", ...
    Leakage=40*(1-bt),Overlap=op, ...
    TimeResolutionMode="specify",TimeResolution=tr);

lblDef = signalLabelDefinition("Atom", ...
    LabelDataType="logical", ...
    LabelType="roiTimeFrequency",TimeFrequencyOptions=opts);

Create a labeled signal set from the signal and time-frequency ROI label definition.

lss = labeledSignalSet(s,lblDef,SampleRate=Fs);

Label the four atoms in time-frequency domain. Set the label values to true.

setLabelValue(lss,1,"Atom",atomTimes,atomFreqs,true(1,4))

Visualize Time-Frequency Image and Label Mask

Create datastores from the labeled signal set for the time-frequency ROI label.

imSize = [512 768];
[sds,ads] = createDatastores(lss,"Atom", ...
    TimeFrequencyMapFormat="image", ...
    TimeFrequencyImageSize=imSize, ...
    TimeFrequencyLabelFormat="mask", ...
    TimeFrequencyMaskPriority=true);

Read and show the time-frequency image.

imagesc(read(sds))

Figure contains an axes object. The axes object contains an object of type image.

Read the label mask and display it above the time-frequency image.

lbl = read(ads);
im = zeros([imSize 3]);
im(:,:,1) = lbl{1};
hold on
imagesc(im,AlphaData=0.5*lbl{1})
hold off

Figure contains an axes object. The axes object contains 2 objects of type image.

Input Arguments

collapse all

Labeled signal set, specified as a labeledSignalSet object.

Example: labeledSignalSet({randn(100,1) randn(10,1)},signalLabelDefinition("female")) specifies a two-member set of random signals containing the attribute "female".

Member row number, specified as a positive integer. midx specifies the member row number as it appears in the Labels table of a labeled signal set.

Label name, specified as a character vector or string scalar.

Label or sublabel name. To specify a label, use a character vector or a string scalar. To specify a sublabel, use a two-element cell array of character vectors or a two-element string array:

  • The first element is the name of the parent label.

  • The second element is the name of the sublabel.

When targeting a sublabel of an ROI or point label, you must also specify the 'LabelRowIndex' of the parent label whose label you want to set. The row of the parent must already exist before you can set a sublabel value to it.

Example: signalLabelDefinition("Asleep",'LabelType','roi') specifies a label of name "Asleep" for a region of a signal in which a patient is asleep during a clinical trial.

Example: {'Asleep' 'REM'} or ["Asleep" "REM"] specifies a region of a signal in which a patient undergoes REM sleep.

Label values, specified as a numeric, logical, or categorical value, as a string, as a table, or as a timetable. val can also be an array of any of the previous types. val must be of the data type specified for lblName.

  • If you specify locs, then val must have the same number of elements as locs.

  • If you specify tLimits, then val must have a number of elements equal to the number of rows in tLimits.

    • If tLimits has more than one row, and lblName is of type 'numeric' or 'logical', then val must be a vector or a cell array.

    • If tLimits has more than one row, and lblName is of type 'string' or 'categorical', then val must be a string array or a cell array of character vectors.

    • If tLimits has more than one row, and lblName is of type 'table' or 'timetable', then val must be a cell array of tables or timetables.

Assign Nonscalar Label Values

To assign nonscalar label values to several points or regions of interest, you must use cell arrays. For example, given the labeled signal set

lss = labeledSignalSet(randn(10,1), [...
    signalLabelDefinition('pl','LabelType','point', ...
                               'LabelDataType','numeric') ...
    signalLabelDefinition('rl','LabelType','ROI', ...
                               'LabelDataType','numeric')]);
the commands
setLabelValue(lss,1,'pl',5,{[3 4]'})
setLabelValue(lss,1,'rl',[2 3; 8 9],{[2 1]' [6 7]})
label point 5 with the column vector [3 4]', the region limited by 2 and 3 with the column vector [2 1]', and the region limited by 8 and 9 with the row vector [6 7].

Point locations, specified as a vector.

  • If lss does not have time information, then locs defines the indices corresponding to the point locations.

  • If lss has time information, then locs defines the instants corresponding to the point locations.

locs must be of the data type specified by the PointLocationsDataType property of the label definition for lblName.

Region time limits, specified as a two-column matrix.

  • If lss does not have time information, then tLimits defines the minimum and maximum indices over which the regions are defined.

  • If lss has time information, then tLimits defines the minimum and maximum instants over which the regions are defined.

tLimits must be of the data type specified by the ROILimitsDataType property of the label definition for lblName.

Example: seconds([0:3; 1:4]')

Example: [0:3; 1:4]'

Region frequency limits, specified as a two-column matrix.

  • If lss does not have time information, then tLimits defines the minimum and maximum normalized frequencies (in radians/sample) over which the function defines the regions.

  • If lss has time information, then tLimits defines the minimum and maximum frequencies (in Hz) over which the function defines the regions.

fLimits must be of the data type specified by the ROILimitsDataType property of the label definition for lblName.

Example: [0:0.02:0.2; 0.3:0.02:0.5]'

Example: [0:20:200; 300:20:500]'

Label row index, specified as a positive integer. This argument applies only for point, ROI and time-frequency ROI labels.

Sublabel row index, specified as a positive integer. This argument applies only when a label and sublabel pair has been specified in lblname and the sublabel is of type ROI or point.

Version History

Introduced in R2018b

expand all