removePointValue
Remove row from point label
Syntax
Description
removePointValue(
removes all rows of the point label lss,midx,lblName)lblName for the member specified by
midx.
If
lblNameis a character vector or a string scalar, the function targets a parent label.If
lblNameis a two-element string array or a two-element cell array of character vectors, the function:Interprets the first element as the name of a parent label.
Interprets the second element as the sublabel name of a point label.
Removes all the points of the sublabel.
removePointValue(
removes a row, specified by lss,midx,lblName,'LabelRowIndex',ridx)ridx, of the point label
lblName for the member midx.
If lblName is a two-element string array or a two-element cell
array of character vectors, the function:
Interprets the first element as the name of a parent label.
Interprets the second element as the sublabel name of a point label.
Removes all the points of the sublabel contained in row
ridx.
removePointValue(
removes the sublabel row specified by lss,midx,lblName,'SublabelRowIndex',sridx)sridx. In this case,
lblName must be a two-element string array or a two-element cell
array of character vectors:
The first element is the name of a parent attribute label.
The second element is the sublabel name of a point label.
removePointValue(
removes the sublabel row specified by lss,midx,lblName,'LabelRowIndex',ridx,'SublabelRowIndex',sridx)sridx of the ROI or point label
row specified by ridx. In this case, lblName must
be a two-element string array or a two-element cell array of character vectors:
The first element is the name of a parent ROI or point label.
The second element is the sublabel name of a point label.
Examples
Load a labeled signal set containing recordings of whale songs. Get the names of the labels and the number of members.
load whales
lss
lss =
labeledSignalSet with properties:
Source: {2×1 cell}
NumMembers: 2
TimeInformation: "sampleRate"
SampleRate: 4000
Labels: [2×3 table]
Description: "Characterize wave song regions"
Use labelDefinitionsHierarchy to see a list of labels and sublabels.
Use setLabelValue to add data to the set.
nm = lss.NumMembers;
Define a point label associated with the signal maximum.
themax = signalLabelDefinition('Maximum','LabelType','point', ...
    'LabelDataType','numeric')
themax =
  signalLabelDefinition with properties:

                      Name: "Maximum"
                 LabelType: "point"
             LabelDataType: "numeric"
        ValidationFunction: []
    PointLocationsDataType: "double"
              DefaultValue: []
                 Sublabels: [0×0 signalLabelDefinition]
                       Tag: ""
               Description: ""

 Use labeledSignalSet to create a labeled signal set.
addLabelDefinitions(lss,themax)
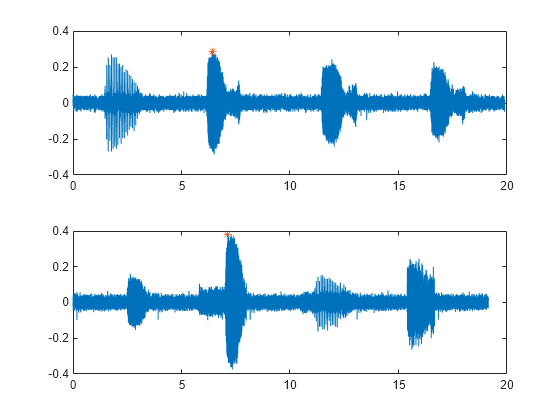
Find the maxima of the signals and add their values to the labeled set.
figure
for idx = 1:nm
    sg = getSignal(lss,idx);
    [mx,ix] = max(sg);
    setLabelValue(lss,idx,'Maximum',ix,mx)

    subplot(nm,1,idx)
    plot((0:length(sg)-1)/lss.SampleRate,sg,ix/lss.SampleRate,mx,'*')
end
Verify that the set includes the new point label.
getLabelValues(lss)
ans=2×4 table
                 WhaleType    MoanRegions    TrillRegions      Maximum
                 _________    ___________    ____________    ___________

    Member{1}      blue       {3×2 table}    {1×3 table}     {1×2 table}
    Member{2}      blue       {3×2 table}    {1×3 table}     {1×2 table}
Remove the 'Maximum' value for the first member of the set. Verify that the label is empty for the first member.
removePointValue(lss,1,'Maximum')

getLabelValues(lss,1)ans=1×4 table
WhaleType MoanRegions TrillRegions Maximum
_________ ___________ ____________ ___________
Member{1} blue {3×2 table} {1×3 table} {0×2 table}
Input Arguments
Version History
Introduced in R2018b