Main Content

mlreportgen.ppt.Border Class

Namespace: mlreportgen.ppt

Border of a table or table entry

Since R2020a

Description

Use an mlreportgen.ppt.Border format object to customize the border of a table or table entry in a PPT API presentation.

Note

A conflict occurs if a border segment is shared by two table entries. For a conflicting horizontal border segment, Microsoft® PowerPoint® ignores the formats specified by the entry on the bottom. For a conflicting vertical border segment, PowerPoint ignores the formats specified by the entry on the right.

The mlreportgen.ppt.Border class is a handle class.

Class Attributes

ConstructOnLoad
true
HandleCompatible
true

For information on class attributes, see Class Attributes.

Creation

Description

example

mlreportgen.ppt.Border creates an empty mlreportgen.ppt.Border object. By default, PowerPoint renders table borders as thin, solid, black lines. Use the object properties to specify a different border width, style, or color.

mlreportgen.ppt.Border(style) sets the Style, TopStyle, BottomStyle, LeftStyle, and RightStyle properties to the value of style.

mlreportgen.ppt.Border(style,color) also sets the Color, TopColor, BottomColor, LeftColor, and RightColor properties to the value of color.

mlreportgen.ppt.Border(style,color,width) also sets the Width, TopWidth, BottomWidth, LeftWidth, and RightWidth properties to the value of width.

Properties

expand all

Default style of border segments, specified as a character vector or string scalar. Specify one of these values:

  • "none"

  • "solid"

  • "dot"

  • "dash"

  • "largeDash"

  • "dashDot"

  • "largeDashDot"

  • "largeDashDotDot"

  • "systemDash"

  • "systemDot"

  • "systemDashDot"

  • "systemDashDotDot"

Default color of border segments, specified as a character vector or string scalar that consists of a CSS color name or hexadecimal RGB value.

Default width of border segments, specified as a character vector or string scalar that consists of a number followed by an abbreviation for a unit of measurement. For example, '3pt' specifies three points. Valid abbreviations are:

  • "px" — pixels

  • "cm" — centimeters

  • "in" — inches

  • "mm" — millimeters

  • "pc" — picas

  • "pt" — points

Style of the top border segment, specified as a character vector or string scalar. Specify one of these values:

  • "none"

  • "solid"

  • "dot"

  • "dash"

  • "largeDash"

  • "dashDot"

  • "largeDashDot"

  • "largeDashDotDot"

  • "systemDash"

  • "systemDot"

  • "systemDashDot"

  • "systemDashDotDot"

Color of the top border segment, specified as a character vector or string scalar that consists of a CSS color name or hexadecimal RGB value.

Width of the top border segment, specified as a character vector or string scalar that consists of a number followed by an abbreviation for a unit of measurement. For example, '3pt' specifies three points. Valid abbreviations are:

  • "px" — pixels

  • "cm" — centimeters

  • "in" — inches

  • "mm" — millimeters

  • "pc" — picas

  • "pt" — points

Style of the bottom border segment, specified as a character vector or string scalar. Specify one of these values:

  • "none"

  • "solid"

  • "dot"

  • "dash"

  • "largeDash"

  • "dashDot"

  • "largeDashDot"

  • "largeDashDotDot"

  • "systemDash"

  • "systemDot"

  • "systemDashDot"

  • "systemDashDotDot"

Color of the bottom border segment, specified as a character vector or string scalar that consists of a CSS color name or hexadecimal RGB value.

Width of the bottom border segment, specified as a character vector or string scalar that consists of a number followed by an abbreviation for a unit of measurement. For example, '3pt' specifies three points. Valid abbreviations are:

  • "px" — pixels

  • "cm" — centimeters

  • "in" — inches

  • "mm" — millimeters

  • "pc" — picas

  • "pt" — points

Style of the left border segment, specified as a character vector or string scalar. Specify one of these values:

  • "none"

  • "solid"

  • "dot"

  • "dash"

  • "largeDash"

  • "dashDot"

  • "largeDashDot"

  • "largeDashDotDot"

  • "systemDash"

  • "systemDot"

  • "systemDashDot"

  • "systemDashDotDot"

Color of the left border segment, specified as a character vector or string scalar that consists of a CSS color name or hexadecimal RGB value.

Width of the left border segment, specified as a character vector or string scalar that consists of a number followed by an abbreviation for a unit of measurement. For example, '3pt' specifies three points. Valid abbreviations are:

  • "px" — pixels

  • "cm" — centimeters

  • "in" — inches

  • "mm" — millimeters

  • "pc" — picas

  • "pt" — points

Style of the right border segment, specified as a character vector or string scalar. Specify one of these values:

  • "none"

  • "solid"

  • "dot"

  • "dash"

  • "largeDash"

  • "dashDot"

  • "largeDashDot"

  • "largeDashDotDot"

  • "systemDash"

  • "systemDot"

  • "systemDashDot"

  • "systemDashDotDot"

Color of the right border segment, specified as a character vector or string scalar that consists of a CSS color name or hexadecimal RGB value.

Width of the right border segment, specified as a character vector or string scalar that consists of a number followed by an abbreviation for a unit of measurement. For example, '3pt' specifies three points. Valid abbreviations are:

  • "px" — pixels

  • "cm" — centimeters

  • "in" — inches

  • "mm" — millimeters

  • "pc" — picas

  • "pt" — points

ID for this PPT API object, specified as a character vector or string scalar. A session-unique ID is generated as part of the object creation. You can specify an ID to replace the generated ID.

Attributes:

NonCopyable
true

Data Types: char | string

Tag for this PPT API object, specified as a character vector or string scalar. A session-unique tag is generated as part of the creation of this object. The generated tag has the form CLASS:ID, where CLASS is the object class and ID is the value of the Id property of the object.

Specifying your own tag value can help you to identify where issues occur during presentation generation.

Attributes:

NonCopyable
true

Data Types: char | string

Examples

collapse all

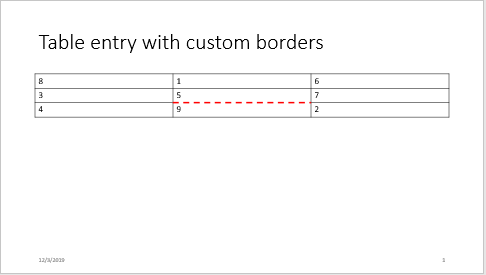
To customize the border or a border segment of a table or table entry in a PPT API presentation, specify the border style, color, and width in an mlreportgen.ppt.Border format object and add the object to the Style property of an mlreportgen.ppt.Table or mlreportgen.ppt.TabeEntry object. This example specifies that the bottom border of the entry in the second row and second column is dashed, red, and has a width of three points.

Create a presentation.

import mlreportgen.ppt.*
ppt = Presentation("myTEBorders.pptx");
open(ppt);

Add a slide to the presentation.

slide = add(ppt,"Title and Table");

Create a table.

t = Table(magic(3));

Create a border object to customize the bottom border segment.

border = Border();
border.BottomStyle = "dash";
border.BottomColor = "red";
border.BottomWidth = "3pt";

Apply the custom border to the entry in the second column and second row.

tr2te2 = t.entry(2,2);
tr2te2.Style = [tr2te2.Style {border}];

Add a title and the table to the slide.

replace(slide,"Title","Table entry with custom borders");
replace(slide,"Table",t);

Close and view the presentation.

close(ppt);
rptview(ppt);

Here is the table in the generated presentation:

Version History

Introduced in R2020a