Main Content

phased.DTIScope

Doppler-time intensity scope

Description

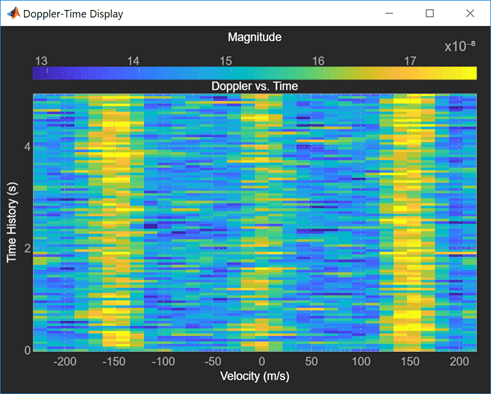
The phased.DTIScope System object™ creates a scrolling display of Doppler response intensity as a function of time. Each row represents the Doppler response for a pulse or FMCW signal. Sequential calls to the object add new rows to the bottom of the display window. Columns represent the responses at specific Doppler values as a function of time. You can input two types of data - in-phase and quadrature (I/Q) data or response data.

  • I/Q data – The input consists of fast-time I/Q samples from one or more pulses or FM sweeps. The scope computes the Doppler response and adds it to the display. To use I/Q data, set the IQDataInput property to true. In this mode, you can set the properties listed in Properties Applicable to I/Q Data.

  • Response data – The data consists of the Doppler response itself as a function of time. The scope only adds the Doppler response to the display. For example, you can obtain Doppler responses from the phased.RangeDopplerResponse System object. To use response data, set the IQDataInput property to false. In this mode, you can set the properties listed in Properties Applicable to Response Data.
To create and run a Doppler-time intensity scope,

  1. Create the phased.DTIScope object and set its properties.

  2. Call the object with arguments, as if it were a function.

To learn more about how System objects work, see What Are System Objects?

Creation

Description

scope = phased.DTIScope creates a Doppler time intensity scope System object, scope. This object displays the Doppler-time response intensity of the input data.

scope = phased.phased.DTIScope(Name,Value) creates a Doppler-time intensity scope object, scope, with each specified property set to the specified value. You can specify additional name-value pair arguments in any order as (Name1,Value1,...,NameN,ValueN). Enclose property names in quotes. For example,

scope = phased.DTIScope('IQInputData',false, ...
        'OperatingFrequency',1e6, ...
        'SampleRate',1e6,'DopplerOutput','Speed', ...
        'OperatingFrequency',10e6,'DopplerFFTLength',512);
creates a scope object that displays a 10-second time span of data using a Doppler FFT size of 512 for I/Q data. The Doppler output units are speed in meters per second.

Properties

expand all

Unless otherwise indicated, properties are nontunable, which means you cannot change their values after calling the object. Objects lock when you call them, and the release function unlocks them.

If a property is tunable, you can change its value at any time.

For more information on changing property values, see System Design in MATLAB Using System Objects.

Display caption, specified as a character vector. The caption appears in the title bar of the window.

Example: 'Multi-target Doppler Time Intensiy Scope'

Tunable: Yes

Data Types: char

Location and size of the intensity scope window, specified as a 1-by-4 vector having the form [left bottom width height].

  • left and bottom specify the location of the bottom-left corner of the window.

  • width and height specify the width and height of the window.

Units are in pixels.

The default value of this property depends on the resolution of your display. By default, the window is positioned in the center of the screen, with a width and height of 800 and 450 pixels, respectively.

Example: [100 100 500 400]

Tunable: Yes

Data Types: double

Type of input data, specified as true or false. When true, the object assumes that the input consists of I/Q sample data and further processing is required in the Doppler domain. When false, the object assumes that the data is response data that has already been processed.

Data Types: logical

Doppler interval between samples, specified as a positive scalar. This property defines the Doppler frequency difference between the scope columns. Units are in Hz.

Data Types: double

Doppler axis offset, specified as a scalar. This property apples a frequency offset to the Doppler axis. Units are in Hz.

Data Types: double

Time interval between samples, specified as a positive scalar. This property defines the time duration between rows of scope. Units are in seconds.

Data Types: double

Time span of the intensity display, specified as a positive scalar. Units are in seconds.

Data Types: double

Response intensity units, specified as a 'db', 'magnitude', or 'power'.

Data Types: char

Doppler output domain, specified as 'Frequency' or 'Speed'. If you set this property to 'Frequency', the Doppler domain is the Doppler shift. Units are in Hz. If you set this property to 'Speed'', the Doppler domain is the corresponding radial speed. Units are in m/s.

Data Types: char

Signal propagation speed, specified as a positive scalar. The default value of this property is the speed of light. See physconst. Units are in meters/second.

Example: 3e8

Dependencies

To enable this property, set the IQDataInput property to true.

Data Types: double

Operating frequency, specified as a positive scalar.

Dependencies

To enable this property, set the IQDataInput property to true and the DopplerOutput to 'Speed'.

Data Types: double

FFT length used in Doppler processing, specified as a positive integer.

Dependencies

To enable this property, set the IQDataInput property to true.

Data Types: double

Usage

Syntax

Description

scope(X) updates and displays the Doppler-time intensity scope for the input data, X. The input X can be I/Q sample data or Doppler response data depending on the value of the IQDataInput property.

example

Input Arguments

expand all

Input data, specified as a complex-valued K-by-L matrix. The interpretation of the data depends on the value of the IQDataInput property.

  • When IQDataInput is true, the input consists of received fast-time and slow-time data for each PRI pulse or FMCW sweep. K denotes the number of time samples. L is the number of pulses in the case of pulsed signals or the number of dechirped frequency sweeps for FMCW signals. The scope computes and displays the Doppler response.

  • When IQDataInput is false, the input already consists of response data in the Doppler domain such as that produced, for example, by phased.RangeDopplerResponse. Each row contains the set of Doppler responses. Each response corresponds to an element of the Dop vector. The scope serves only as a display of the Doppler response.

Object Functions

To use an object function, specify the System object as the first input argument. For example, to release system resources of a System object named obj, use this syntax:

release(obj)

expand all

showTurn on visibility of scopes
hideTurn off visibility of scope
isVisibleVisibility of scopes
stepRun System object algorithm
releaseRelease resources and allow changes to System object property values and input characteristics
resetReset internal states of System object

Examples

collapse all

Create a phased.DTIScope object to view a scrolling Doppler-Time Intensity map.

Load the example data.

load('RTIDTIExampleData.mat')
rx_pulses = zeros(numel(fast_time),num_pulse_int);

Create the DTI scope.

scope = phased.DTIScope('IQDataInput',false,...
    'DopplerOutput','Speed',...
    'PropagationSpeed',c,...
    'OperatingFrequency',fc,...
    'Name','Doppler-Time Display',...
    'DopplerResolution',DopplerRes, ...
    'DopplerOffset',-prf/2,...
    'TimeResolution',0.05,...
    'TimeSpan',5,...
    'IntensityUnits','magnitude',...
    'Position',[560 375 560 420]);

Obtain the pulse repetition interval, 33.3564 microsec.

pri = 1/prf;

Transmit 2000 pulses and coherently process a train of 10 pulses at a time. There are 200 trains. After each pulse, move the target and radar platform. The radar reflects off three targets. The first moves along the x-axis at -150 m/sec. The second moves along the x-axis at +150 m/sec. The third target is stationary. After each pulse train, compute the Doppler response using an FFT.

nsteps = 200;
for k = 1:nsteps
    for m = 1:num_pulse_int
        [ant_pos,ant_vel] = radarplatform(pri);
        [tgt_pos,tgt_vel] = targetplatforms(pri);
        sig = waveform();
        [s,tx_status] = transmitter(sig);
        [~,tgt_ang] = rangeangle(tgt_pos,ant_pos);
        tsig = radiator(s,tgt_ang);
        tsig = channels(tsig,ant_pos,tgt_pos,ant_vel,tgt_vel);
        rsig = targets(tsig);
        rsig = collector(rsig,tgt_ang);
        rx_pulses(:,m) = preamplifier(rsig,~(tx_status>0));
    end
    
    rx_pulses = gain(rx_pulses);
    dshift = fft(rx_pulses.');
    dshift = fftshift(abs(dshift),1);
    scope(mean(dshift,2));
    
    pause(0.1)
    radarplatform(.05);
    targetplatforms(.05);
end

More About

expand all

Version History

Introduced in R2019a