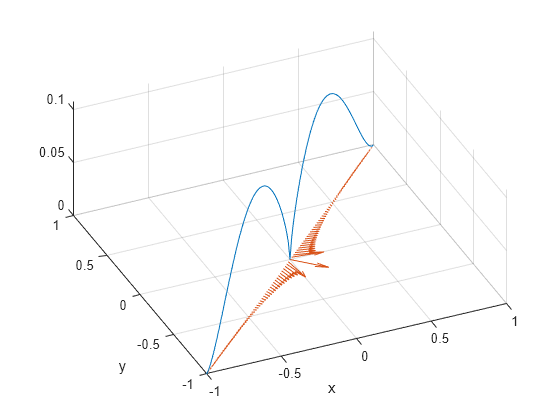
Visualization
Plot and explore structural, thermal, and electromagnetic solutions, as
well as general PDE results
Plot and analyze results returned by three types of workflows: unified
femodel, domain-specific, and general PDE. For
plotting and animations, you can use the interactive controls in the
Visualize PDE Results Live Editor task, the PDE
plotting functions, or MATLAB® plotting functions.
Functions
Live Editor Tasks
| Visualize PDE Results | Create and explore visualizations of PDE results in the Live Editor (Since R2022b) |
Properties
| PDEVisualization Properties | PDE visualization of mesh and nodal results (Since R2021a) |
Topics
- Dimensions of Solutions, Gradients, and Fluxes
Learn about the dimensions of stationary, time-dependent, and eigenvalue results at mesh nodes and arbitrary locations.


