Visualization
Plot and analyze results returned by three types of workflows: unified
femodel, domain-specific, and general PDE. For
plotting and animations, you can use the interactive controls in the
Visualize PDE Results Live Editor task, the PDE
plotting functions, or MATLAB® plotting functions.
Functions
Live Editor Tasks
| Visualize PDE Results | Create and explore visualizations of PDE results in the Live Editor (Since R2022b) |
Properties
| PDEVisualization Properties | PDE visualization of mesh and nodal results |
Topics
- Dimensions of Solutions, Gradients, and Fluxes
Learn about the dimensions of stationary, time-dependent, and eigenvalue results at mesh nodes and arbitrary locations.
Featured Examples

Static and Animated Plots with Visualize PDE Results Live Editor Task
Plot and animate PDE solutions using the Visualize PDE Results Live Editor task, generate code, and export animations.

Solution Plots with pdeviz
Create and plot a PDE visualization object whose properties control the appearance of the plot.

Solution and Gradient Plots with pdeplot and pdeplot3D
Plot 2-D and 3-D PDE solutions and their gradients using
pdeplot and pdeplot3D.
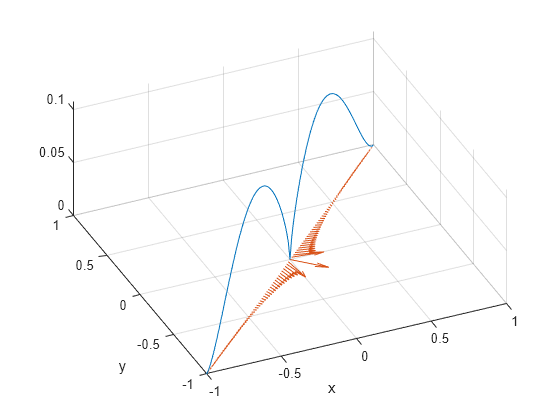
2-D Solution and Gradient Plots with MATLAB Functions
Plot 2-D PDE solutions and their gradients using surf,
mesh, quiver, and other MATLAB functions.

2-D Slices Through 3-D Geometry with MATLAB Functions
Obtain plots from 2-D slices through a 3-D geometry.

Contour Slices Through 3-D Solution with MATLAB Functions
Create contour slices in various directions through a solution in 3-D geometry.

Plots of Gradients and Streamlines with MATLAB Functions
Calculate the approximate temperature gradient, and how to use the gradient in a quiver plot or streamline plot.