Beschreibende Statistik und Erkenntnisse
Zusammenfassen von Daten mithilfe beschreibender Statistik und Regressionsmodellen
Die beschreibende Statistik beschreibt quantitativ die Merkmale eines Datensatzes. Sie können Ihre Daten mit beschreibender Statistik wie Mittelwert, Median, Standardabweichung und Perzentilen auswerten und zusammenfassen. Zudem können Sie durch Analyse von Korrelationen und Anpassung von Regressionsmodellen die Beziehungen zwischen Variablen bewerten.
Funktionen
Themen
Statistik
- Compute Mean, Median, and Other Descriptive Statistics
Summarize data by computing one or more simple descriptive statistics. - Compare Global, Moving, and Cumulative Statistics
Get data insights by computing and visualizing global, moving, and cumulative statistics. - Explore Basic Statistics on 2-D Plot
Interactively summarize data by computing, visualizing, and saving descriptive statistics for 2-D plotted data using the Data Statistics tool.
Regression und Prognose
- Linear Correlation
Covariance and correlation coefficients help to describe the linear relationship between variables. - Lineare Regression mit einer Prädiktorvariable
Passen Sie mitpolyfitein lineares Regressionsmodell erster und zweiter Ordnung an und werten Sie es mitpolyvalfür eine Prädiktor- und eine Reaktionsvariable aus. - Linear Regression with Nonpolynomial Terms
Fit a nonpolynomial linear regression model for one predictor variable and one response variable by constructing a design matrix and using the backslash operator (\). - Linear Regression with Multiple Predictor Variables
Fit a polynomial linear regression model for multiple predictor variables and one response variable by constructing a design matrix and using the backslash operator (\). - Interactively Fit Data and Visualize Model
Interactively fit and validate polynomial regression models for 2-D plotted data by using the Basic Fitting tool. Then, use the models to interpolate and extrapolate the data.
Enthaltene Beispiele
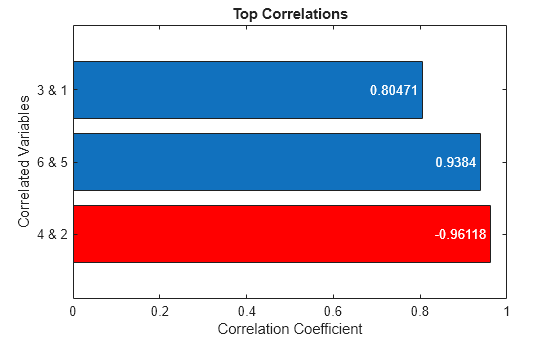
Identify and Visualize Correlated Variables
Calculate, filter, rank, and visualize correlations between variables.