
Add multiple y-axes to plots. zoomable with zoom modification.
Adds multiple axes to plots using addaxis.m. Automatically adjusts axes to accomodate as many axes as you want.Add more plots to any added axes with addaxisplot.mAdd y-labels to any of the axes with
- 36,9K (insgesamt)
- 46 (letzte 30 Tage)
- 4,4 / 5
- Community
-
7. Jul 2016
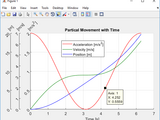
Plotting function that allows for N y-axes using a common x axis
This function allows for results to be plotted on N separate y-axes. These y-axes share a common x axis, but do not need to share exactly the same x/y data or size. The function supports all
- 3,4K (insgesamt)
- 32 (letzte 30 Tage)
- 4,9 / 5
- Community
-
11. Aug 2019

MULTIPLOTYYY allows the user to plot multiple lines on three sets of y-axes.
MULTIPLOTYYY plots using three sets of y-axes values. Additionally, multiple lines can be plotted against each y-axis. Therefore, the inputs to the function must be grouped into cell arrays.Here is
- 4,5K (insgesamt)
- 19 (letzte 30 Tage)
- 4,9 / 5
- Community
-
1. Sep 2016

Plotly | Online MATLAB Graphing
Publish your MATLAB figures to the web with one line of code.
graphs with a single line of code:```[X, Y, Z] = peaks;contour(X,Y,Z,20)fig2plotly()```This code generates this graph in your browser: https://plot.ly/~demos/1574For more, see the official documentation at
- 4,9K (insgesamt)
- 24 (letzte 30 Tage)
- 5,0 / 5
- Community
-
15. Aug 2024
Create axes object with multiple y-axis in Figure or App Designer
Object orientated approach for creating plots with three or more y axis. myaxisc, short for "Multiple Y Axis Class", is a class holding all the axes objects needed to display multiple Y axis. Second
- 1,1K (insgesamt)
- 4 (letzte 30 Tage)
- 4,9 / 5
- Community
-
6. Feb 2019

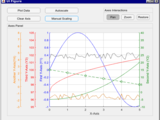
Add multiple X or Y axes to plots, rescale data, use any function, add data tips, zoom, flexible.
This package will allow you to plot data on multiple X or Y axis. Similar to MATLAB's own plotyy function, but less limiting. Features: Create any combination of X or Y axes, plot multiple lines on
- 2,2K (insgesamt)
- 2 (letzte 30 Tage)
- 3,7 / 5
- Community
-
9. Dez 2015

Plotting data on multiple y-axes in the same figure for MATLAB.
addy_axisA new take on plotting data across multiple y-axes in MATLAB. Creates a pair of visible/invisible axes: the invisible one is used to overlay data with the existing main axes, while the
- 23 (insgesamt)
- 1 (letzte 30 Tage)
- -- / 5
- Community
-
19. Jul 2024

PLOTYYY - Extends plotyy to include a third y-axis
PLOTYYY builds upon plotyy to include a third y-axis. It also provides an easy way of labelling all three y-axes at once.
- 31,8K (insgesamt)
- 92 (letzte 30 Tage)
- 4,6 / 5
- Community
-
14. Nov 2001

Myplotyy plots different data sets with a common x-axis but using individual y-axes in one figure.
Myplotyy plots different data sets with a common x-axis but using individual y-axes in one figure. The properties of every curve (y-axis) can be individually adjusted, such as linear or logarithmic
- 3,1K (insgesamt)
- 2 (letzte 30 Tage)
- 4,7 / 5
- Community
-
12. Mai 2011

ScrollPlot - scrollable X/Y axes
ScrollPlot adds a scroll sub-window to any supplied plot handles
) modifies the corresponding scroll patch(es) accordingly.Both X & Y scrolling are possible.Custom properties provide access to the scroll axes, central patch and side-bars, for user customizations (e.g
- 10,4K (insgesamt)
- 3 (letzte 30 Tage)
- 4,8 / 5
- Community
-
16. Jul 2015

multiple colon-intervals
Return a concatenation of multiple colon-intervals.User provides left, step, and right bound.>> mcolon([0 10],[1 2],[2 14])ans = 0 1 2 10 12 14
- 1,1K (insgesamt)
- 1 (letzte 30 Tage)
- 5,0 / 5
- Community
-
3. Jan 2011
Plots data on separate y-axes
- 536 (insgesamt)
- 1 (letzte 30 Tage)
- -- / 5
- Community
-
3. Mai 2010

PLOTY4 support for a third and fourth y-axis.
PLOTY4 is based on plotyyy by Denis Gilbert and allows a fourth y-axis. Labelling of all four y-axes is possible.
- 11,4K (insgesamt)
- 6 (letzte 30 Tage)
- 4,7 / 5
- Community
-
2. Aug 2009

Detect and Track Multiple Faces
Detect and track multiple faces from live video.
This is a simple system for detecting and tracking multiple faces from live video. It uses the Computer Vision System Toolbox and the Webcam Support Package. The system detects faces using the
- 12,9K (insgesamt)
- 5 (letzte 30 Tage)
- 4,7 / 5
- Community
-
1. Sep 2016

Plot data with error bars on both x and y axes
plot data with error bars along both x and y axes
Sjöberg(http://www.mathworks.com/matlabcentral/fileexchange/5444-xyerrorbar)errorbarxy(x, y, lerrx, uerrx, lerry, uerry) plots the data with errorbars on bothx and y axes with error bars [x-lerrx, x+uerrx] and [y-lerry, y+uerry]. If there isno error on one axis, set corresponding lower
- 13,5K (insgesamt)
- 3 (letzte 30 Tage)
- 4,4 / 5
- Community
-
7. Jan 2016

This function adds a second y-axis to a x-y plot using a relationship between the two y-axes.
This function allows to use two different y-axes with the same data in one plot. Note, that only one curve but in two different units is shown. This is the difference to plotyy which plots two
- 1,3K (insgesamt)
- 1 (letzte 30 Tage)
- 4,2 / 5
- Community
-
2. Jun 2010

Multiple matrix multiplications, with array expansion enabled
Multiplying matrices, vectors, or scalars contained in two N-D arrays, with array expansion enabled.
with multidimensional arrays.MULTIPROD performs multiple multiplications between matrices, vectors, or scalars contained in two multidimensional arrays, with automatic virtual array expansion (AX
- 9,9K (insgesamt)
- 1 (letzte 30 Tage)
- 4,9 / 5
- Community
-
26. Jul 2010
Multiple same-size linear solver
Solve multiple systems of linear equations of the same size
- 3,6K (insgesamt)
- 2 (letzte 30 Tage)
- 5,0 / 5
- Community
-
26. Mai 2010

Set functions with multiple inputs
Intersectm, ismemberm, setdiffm, setxorm, unionm with multiple inputs. Ex: intersectm(a,b,c,…).
Have you ever tried to find the common elements/rows to more than two sets without using a loop?Now you can with multiple-input set functions: Intersectm, ismemberm, setdiffm, setxorm, unionm.Brief
- 1,6K (insgesamt)
- 1 (letzte 30 Tage)
- 5,0 / 5
- Community
-
6. Aug 2010
Multicore - Parallel processing on multiple cores
This package provides parallel processing on multiple cores/machines.
This package provides parallel processing on multiple cores on a single machine or on multiple machines that have access to a common directory.If you have multiple function calls that are independent
- 21,3K (insgesamt)
- 10 (letzte 30 Tage)
- 4,8 / 5
- Community
-
21. Jul 2014
- 5,5K (insgesamt)
- 3 (letzte 30 Tage)
- 4,8 / 5
- Community
-
1. Nov 2004
Multiple Precision Toolbox for MATLAB
This toolbox defines a new mp class allowing multiple precision objects in MATLAB.
- 13,7K (insgesamt)
- 12 (letzte 30 Tage)
- 4,0 / 5
- Community
-
4. Aug 2022

Program to create a figure with multiple tabs and demo their use.
This function creates a figure with multiple Tabs. The number of tabs can be changed and they are distributed evenly across the top of the figure. Content is provided for the first 5 tabs to demo
- 11,2K (insgesamt)
- 1 (letzte 30 Tage)
- 4,9 / 5
- Community
-
4. Feb 2014

yyaxis tools: yyzoom, yytick, yyaxtoolbar
enhanced zooming, ticks, and interactive exploration of yyaxis charts
This submission contains the following tools to facilitate the interaction with yyaxis charts:yyzoom – allow zooming and panning both y-axes of a yyaxis plot simultaneouslyyytick – align ticks on
- 366 (insgesamt)
- 1 (letzte 30 Tage)
- 5,0 / 5
- Community
-
22. Apr 2024

Violin Plots for plotting multiple distributions (distributionPlot.m)
Function for plotting multiple histograms side-by-side in 2D - better than boxplot.
(http://www.mathworks.com/matlabcentral/fileexchange/37105).DistributionPlot allows visualizing multiple distributions side by side. It is useful for skewed unimodal data and indispensable for multimodal data. DistributionPlot is especially useful for showing the time
- 14,8K (insgesamt)
- 14 (letzte 30 Tage)
- 5,0 / 5
- Community
-
11. Feb 2017

- 1,4K (insgesamt)
- 2 (letzte 30 Tage)
- 5,0 / 5
- Community
-
24. Jul 2021
Recursive Directory Searching for Multiple File Specs
Searches a directory for multiple file specs with optional recursivity
. This value is locale-dependent. EXAMPLES: Example 1: Recursive directory listing of the current directory d = dir2(pwd,'-r') {d.name}' Example 2: Using multiple
- 1,5K (insgesamt)
- 2 (letzte 30 Tage)
- 4,8 / 5
- Community
-
20. Feb 2013

Smooths contour lines by fitting them with a 2-D spline.
CONTOURSPLINE(X,Y,Z,N) creates a contour plot having N contour levels from the matrix Z, treating the values in Z as heights above the X-Y plane. X and Y are either vectors defining the X- and Y-axes
- 2,8K (insgesamt)
- 2 (letzte 30 Tage)
- 4,7 / 5
- Community
-
31. Okt 2012
Multiple eigen-values for 2x2 and 3x3 matrices
Compute in one shot the eigen-values of multiples (3 x 3) matrices using Cardan's formula
- 1,9K (insgesamt)
- 2 (letzte 30 Tage)
- 4,6 / 5
- Community
-
26. Mär 2021

Grouped boxplots matlb ploting function
, 200; 51,153,255, 200; 0, 0, 255, 200];col=col/255;multiple_boxplot(data',xlab,{'A', 'B', 'C'},col')title('Here it is!')
- 2,5K (insgesamt)
- 2 (letzte 30 Tage)
- 4,9 / 5
- Community
-
15. Jul 2014

Multiple XY Graph for Simulink®
This is an XY-Graph block that is based on the Level-2 MATLAB S-Function API to plot multiple trajectories. The zip file contains the associated S-function and an example model.
- 1,4K (insgesamt)
- 3 (letzte 30 Tage)
- 5,0 / 5
- Community
-
6. Mai 2020

Multiple curve fitting with common parameters using NLINFIT
Wrapper for NLINFIT which allows simultaneous fitting for multiple data sets with shared parameters.
This function allows you to simultaneously fit multiple data sets (for example noisy measurements) with multiple models, which share some (or all) of the fitting parameters.Unlike difference
- 4,1K (insgesamt)
- 5 (letzte 30 Tage)
- 4,6 / 5
- Community
-
20. Apr 2016
labelxy -- labels the X and Y axes "X" and "Y"
labelxy -- labels the X and Y axes "X" and "Y"
labelxy -- labels the X and Y axes "X" and "Y".This is a quick shortcut that is useful for generic plots.
- 154 (insgesamt)
- 1 (letzte 30 Tage)
- -- / 5
- Community
-
8. Jun 2012
labelxyz -- labels the (X,Y,Z) axes "X", "Y", and "Z".
labelxyz -- labels the (X,Y,Z) axes "X", "Y", and "Z".
labelxyz -- labels the (X,Y,Z) axes "X", "Y", and "Z".This is a quick shortcut that is useful for generic plots and also useful for seeing which direction is which in a 3D plot.
- 144 (insgesamt)
- 1 (letzte 30 Tage)
- -- / 5
- Community
-
8. Jun 2012

Visualize data as a heatmap with many customizable options.
properties:* X- and Y-axes tick labels: Display the row/column indices or any other numeric or text labels. X-axis tick labels can even be rotated. * Text labels: Overlay the heatmap image with formatted text
- 21,4K (insgesamt)
- 10 (letzte 30 Tage)
- 5,0 / 5
- Community
-
1. Sep 2016

fix_xticklabels - automatically convert xticklabels to multiple line format
It will determine maximum allowed width of XTickLabels and convert them into multiple line format
FIX_XTICKLABELS will determine maximum allowed width of long XTickLabels and convert them into multiple line format to fit maximum allowed width IN: handle [optional] - axes handle
- 3,2K (insgesamt)
- 1 (letzte 30 Tage)
- 4,9 / 5
- Community
-
22. Sep 2014

Superimpose multiple semitransparent images with individual colormaps on the current axis.
Remaps CData for multiple images, plotted in the current axis, to their respective individual colormaps. Multiple examples provided. The examples also demonstrate how semitransparent effects can be
- 1,2K (insgesamt)
- 1 (letzte 30 Tage)
- 5,0 / 5
- Community
-
3. Mär 2012

Multiple Rapidly-exploring Random Tree (RRT)
Multiple RRT implementation for mobile robot path planning or C-space manipulator motion planning
% See Usage section in RrtPlanner.m file. This is a basic example of usage:treesMax = 28; %How many multiple trees (must be at least 2, 1 for source and 1 for destinationseedsPerAxis = 3; %Number of
- 7,2K (insgesamt)
- 5 (letzte 30 Tage)
- 5,0 / 5
- Community
-
31. Okt 2013

Scroll a zoomed axes in x/y direction related to full view
The function zoomOrientation reduces width and height of an axes and adds two new axes, xOrientation and yOrientation plus xSlider and ySlider. You can either use the mouse wheel to zoom in/out or
- 407 (insgesamt)
- 1 (letzte 30 Tage)
- 5,0 / 5
- Community
-
15. Mär 2016

mplot: Multiple plots in a single figure with list box selection
Adds multiple plot instructions to a figure and the user chooses which one to use from a list box.
mplot figure instead of the currently active onex = 1:100; y = rand(1,100); mplot('my caption', x, y, 'kx');% assigns the given caption to the newly added plotfun = @(ax) plot(ax, x, y, 'k.'); mplot(fun
- 1,7K (insgesamt)
- 2 (letzte 30 Tage)
- 5,0 / 5
- Community
-
2. Okt 2010

Simscape Multibody Multiphysics Library
Extend Simscape Multibody models with physical effects spanning multiple physical domains.
- 21,3K (insgesamt)
- 89 (letzte 30 Tage)
- 4,6 / 5
- Community
-
18. Mai 2026

Multiple Target Tracking with Multiple Observations
Tracking of multiple targets using particle filter. This was a redo from last work.
- 2,4K (insgesamt)
- 1 (letzte 30 Tage)
- 5,0 / 5
- Community
-
17. Sep 2013
create graphs with 3 different Y axes and errorbars for each curve.
The function is built over PLOTYYY in order to create 3 Y axes and having errorbars for the curves.It's has the exact abilities of PLOTYYY with extra features for errorbars.The zip file include two
- 285 (insgesamt)
- 1 (letzte 30 Tage)
- -- / 5
- Community
-
9. Feb 2016

truncAxis (break X/Y axis | 截断坐标轴)
Create broken axes by truncating X and/or Y axis, supporting logarithmic scaling and reversed axis and resizing the axes based on X/Y range.
13;ax.XTick = 1:5;ax.XTickLabel = {'A', 'B', 'C', 'D', 'E'};axMat = truncAxis('Y', [50, 155]);axMat(1).Children(end).BaseLine.Color = 'none';% Add legendlegend({'AAAAA', 'BBBBB'}, 'FontSize', 13);
- 741 (insgesamt)
- 9 (letzte 30 Tage)
- 5,0 / 5
- Community
-
11. Mai 2026

Learn how to control a basic Robotic System using a Desktop Computer, a Kinect and an Arduino.
- 2,1K (insgesamt)
- 3 (letzte 30 Tage)
- 5,0 / 5
- Community
-
27. Feb 2017

mmROI (multiple images with multiple ROIs)
open multiple images and preform multiple ROIs process
1) Goal: Interactively process MULTIPLE images with MULTIPLE ROIs (so-called mmROI), which returns ROI mean, std, min, max, median, area and center(X,Y), and plots the mean/std values along the image
- 6,5K (insgesamt)
- 1 (letzte 30 Tage)
- 4,3 / 5
- Community
-
18. Apr 2005

This toolbox includes eight different approaches to deal with the Multiple Comparisons Problem.
The "Multiple Testing Toolbox" includes a compilation of eight different algorithms to deal with the Multiple Comparisons Problem, focusing on both the correction of the Family-Wise Error Rate (FWER
- 1,8K (insgesamt)
- 6 (letzte 30 Tage)
- 5,0 / 5
- Community
-
26. Apr 2021

MDMTSPV_GA - Multiple Depot Multiple Traveling Salesmen Problem solved by Genetic Algorithm
Genetic Algorithm Solution to the Multiple Depots, MTSP, with Variable number of salesmen
- 2K (insgesamt)
- 1 (letzte 30 Tage)
- 4,8 / 5
- Community
-
15. Jun 2011
MUSIC (Multiple Signal Classification) Algorithm
MUSIC (Multiple Signal Classification)
MUSIC (Multiple Signal Classification) is one of the earliest proposed and a very popular method for super-resolution direction-finding. These methods relying on the decomposition of the observation
- 1,3K (insgesamt)
- 1 (letzte 30 Tage)
- 5,0 / 5
- Community
-
10. Mai 2021

Getting Started Guide RoboNation
Examples to get started with MATLAB and Simulink for RoboNation competitions
- 3,8K (insgesamt)
- 2 (letzte 30 Tage)
- 5,0 / 5
- Community
-
15. Nov 2017
errorbars on x and y axes with many options.
Plot graph with error bars on both axes.% simple example:Data = [1 10 1; 2 9 0.5; 3 8 0.7];errorxy(Data)
- 5,8K (insgesamt)
- 1 (letzte 30 Tage)
- 4,5 / 5
- Community
-
19. Jan 2006

Multiple-Symbol Differential Sphere Decoding
Multiple-Symbol Differential Sphere Decoding
simulation of the following paper:Lampe, L.; Schober, R.; Pauli, V.; Windpassinger, C., "Multiple-symbol differential sphere decoding," Communications, IEEE Transactions on , vol.53, no.12
- 454 (insgesamt)
- 1 (letzte 30 Tage)
- 5,0 / 5
- Community
-
18. Aug 2014
Polynomials with multiple roots solved
Solving multiple roots polynomial, using simple elementary arithematic operations mostly.
A given polynomial having multiple roots is solved by the routine Z = poly_roots(p)where Input p: polynomial coefficient vector Output Z: root-multiplicity
- 2K (insgesamt)
- 1 (letzte 30 Tage)
- 5,0 / 5
- Community
-
15. Mai 2014

3D comet plot of multiple objects
Plots trajectories of multiple objects in 3D with controllable speed and tail length
comet3n plots trajectories of multiple objects in 3D with controllable speed and tail length. It takes an M*5 array as an input. Column 1-4 is the (x,y,z,t) coordinate of an object, respectively
- 856 (insgesamt)
- 1 (letzte 30 Tage)
- 5,0 / 5
- Community
-
4. Okt 2016

Use multiple colormaps per figure or axis! Works for many types of objects, not only images.
freezeColors/unfreezeColorsfreezeColors allows multiple colormaps to be used per figure and even within a single axis.HistoryIn 2005 freezeColors was written to enable multiple colormaps in a single
- 51,6K (insgesamt)
- 33 (letzte 30 Tage)
- 4,7 / 5
- Community
-
25. Jul 2022
Bonferroni-Holm Correction for Multiple Comparisons
Adjusts a family of p-values via Bonferroni-Holm method to control probability of false rejections.
Bonferroni-Holm (1979) correction for multiple comparisons. This is a sequentially rejective version of the simple Bonferroni correction for multiple comparisons and strongly controls the
- 5,9K (insgesamt)
- 10 (letzte 30 Tage)
- 4,7 / 5
- Community
-
17. Sep 2012
CARTPROD: Cartesian product of multiple sets
Returns a matrix containing the cartesian product of multiple input sets.
CARTPROD Cartesian product of multiple sets. (The cartesian product of multiple input sets is a larger set containing every ordered combination of the input set elements. See example below.)X =
- 5K (insgesamt)
- 5 (letzte 30 Tage)
- 4,0 / 5
- Community
-
16. Jul 2004
Input a set of numbers as an n-dimension array, get their least common multiple.
I wanted to find the least common multiple of a group of more than two numbers. Matlab's built in lcm function does not have this capability. It accepts two integer inputs, but cannot handle more. So
- 2K (insgesamt)
- 3 (letzte 30 Tage)
- 5,0 / 5
- Community
-
10. Jul 2009
Vicon Tracker S Function for Simulink and Matlab
Vicon Tracker S Function and Simulink Model Samples
and multiple object examples on the same port are provided using the DSSDK as well as the UDP stream, the only difference in those examples is the method of data access. There is an additional example
- 589 (insgesamt)
- 3 (letzte 30 Tage)
- 5,0 / 5
- Community
-
10. Jun 2015