evaluateObjectDetection
Syntax
Description
metrics = evaluateObjectDetection(detectionResults,groundTruthData)detectionResults
against the labeled ground truth groundTruthData and returns various
metrics.
metrics = evaluateObjectDetection(detectionResults,groundTruthData,threshold)
metrics = evaluateObjectDetection(___,Name=Value)AdditionalMetrics="AOS" includes average orientation similarity
metrics in the output.
Examples
Load a table containing images and ground truth bounding box labels. The first column contains the images, and the remaining columns contain the labeled bounding boxes.
data = load("vehicleTrainingData.mat");
trainingData = data.vehicleTrainingData;
Set the value of the dataDir variable as the location where the vehicleTrainingData.mat file is located. Load the test data into a local vehicle data folder.
dataDir = fullfile(toolboxdir("vision"),"visiondata");
trainingData.imageFilename = fullfile(dataDir,trainingData.imageFilename);
Create an imageDatastore using the files from the table.
imds = imageDatastore(trainingData.imageFilename);
Display the first 5 rows of the training data table.
disp(trainingData(1:5,:))
                                                              imageFilename                                                                  vehicle
    _________________________________________________________________________________________________________________________________    ________________

    "/mathworks/devel/bat/filer/batfs2566-0/Bdoc26a.3233028/build/runnable/matlab/toolbox/vision/visiondata/vehicles/image_00001.jpg"    {[126 78 20 16]}
    "/mathworks/devel/bat/filer/batfs2566-0/Bdoc26a.3233028/build/runnable/matlab/toolbox/vision/visiondata/vehicles/image_00002.jpg"    {[100 72 35 26]}
    "/mathworks/devel/bat/filer/batfs2566-0/Bdoc26a.3233028/build/runnable/matlab/toolbox/vision/visiondata/vehicles/image_00003.jpg"    {[ 62 69 26 19]}
    "/mathworks/devel/bat/filer/batfs2566-0/Bdoc26a.3233028/build/runnable/matlab/toolbox/vision/visiondata/vehicles/image_00004.jpg"    {[ 71 64 22 21]}
    "/mathworks/devel/bat/filer/batfs2566-0/Bdoc26a.3233028/build/runnable/matlab/toolbox/vision/visiondata/vehicles/image_00005.jpg"    {[147 71 25 18]}
Create a boxLabelDatastore using the label columns from the table.
blds = boxLabelDatastore(trainingData(:,2:end));
Load Pretrained Object Detector
Load a pretrained YOLO v2 object detector trained to detect vehicles into the workspace.
vehicleDetector = load("yolov2VehicleDetector.mat");
detector = vehicleDetector.detector;
Evaluate and Plot Object Detection Metrics
Run the detector on the test images. Set the detection threshold to a low value to detect as many objects as possible. This helps you evaluate the detector precision across the full range of recall values.
results = detect(detector,imds,Threshold=0.01);
Use evaluateObjectDetection to compute metrics for evaluating the performance of an object detector.
metrics = evaluateObjectDetection(results,blds);
Return the precision and recall metrics for the vehicle class using the precisionRecall object function.
[recall,precision,scores] = precisionRecall(metrics);
ap = averagePrecision(metrics);
Plot the precision-recall curve for the vehicle class, the only class in the data set. Compute the average precision (AP) using the averagePrecision object function.
figure
plot(recall{1},precision{1})
grid on
title("Average Precision = " + ap);
xlabel("Recall");
ylabel("Precision");
Compute the summary of the object detection metrics for the data set using the summarize object function.
[summaryDataset,summaryClass] = summarize(metrics);
disp(summaryDataset)
    NumObjects    mAPOverlapAvg    mAP0.5
    __________    _____________    _______

       336           0.99096       0.99096
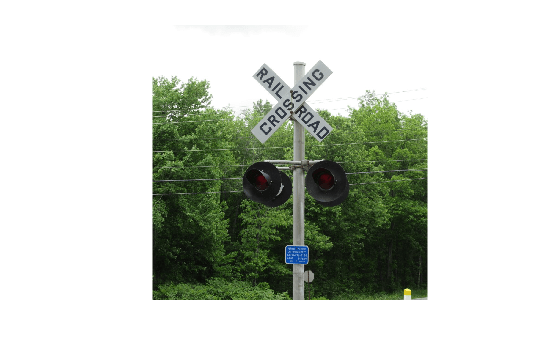
This example shows how to evaluate the predictions from a trained ACF object detector on a dataset of rail road signs.
The test dataset images are stored as a zipped file attached to this example. Unzip this into the current working directory.
unzip("RRSignsTest.zip")Load the ground truth for the railroad signs test dataset stored as a groundTruth object.
load("RRSignsGroundTruth.mat", "gTruthTest")
Load the pretrained ACF object detector.
load("RRSignsACFDetector.mat", "acfDetector")
Extract images and bounding boxes from the groundTruth object by using the objectDetectorTrainingData function. The function creates and stores data in the form an image datastore and a labeled bounding box datastore.
[imdsTest, bldsTest] = objectDetectorTrainingData(gTruthTest);
imshow(preview(imdsTest))
Combine the test images and ground truth labels into a single datastore.
testData = combine(imdsTest, bldsTest);
Run the detector on the test images.
testDetections = detect(acfDetector,testData);
Arrange the detector results into a format suitable for object detection evaluation. The ACF object detector does not explicitly predict the class label of an object. This label information needs to be added to the testDetections table.
numImages = height(testDetections);
labels = cell(numImages,1);
className = string(gTruthTest.LabelDefinitions.Name{1});
for i = 1:numImages
    numDetections = numel(testDetections.Scores{i});
    labels{i} = categorical(repmat(className, [numDetections 1]), className);
end

testDetections.Labels = labels;
Evaluate the detector results.
metrics = evaluateObjectDetection(testDetections, testData);
Display the average precision metric, which summarizes the detector's performance over the test dataset. The ACF detector performs well on this dataset with an AP of 0.8.
disp(summarize(metrics, MetricName="AP")) NumObjects mAPOverlapAvg mAP0.5
__________ _____________ ______
10 0.8 0.8
Display the detector performance on individual images.
imageSummary = imageMetrics(metrics);
disp(imageSummary)
    ImageIndex    NumPredictedObjects    NumGroundTruthObjects    TP    FP    FN    Precision    Recall
    __________    ___________________    _____________________    __    __    __    _________    ______

         1                 1                       1              1     0     0          1         1
         2                 1                       1              1     0     0          1         1
         3                 0                       1              0     0     1        NaN         0
         4                 1                       1              1     0     0          1         1
         5                 1                       1              1     0     0          1         1
         6                 1                       1              1     0     0          1         1
         7                 1                       1              1     0     0          1         1
         8                 1                       1              1     0     0          1         1
         9                 1                       1              1     0     0          1         1
        10                 0                       1              0     0     1        NaN         0
The detector makes a mistake on only 2 out of 10 images in the test set, shown on rows 3 and 10.
This example shows how to evaluate miss rate of a pretrained YOLO v2 object detector.
Load the Vehicle Ground Truth Data
Load a table containing the vehicle training data. The first column contains the training images, the remaining columns contain the labeled bounding boxes.
data = load('vehicleTrainingData.mat');
trainingData = data.vehicleTrainingData(1:100,:);
Add fullpath to the local vehicle data folder.
dataDir = fullfile(toolboxdir('vision'), 'visiondata');
trainingData.imageFilename = fullfile(dataDir, trainingData.imageFilename);
Create an imageDatastore using the files from the table.
imds = imageDatastore(trainingData.imageFilename);
Create a boxLabelDatastore using the label columns from the table.
blds = boxLabelDatastore(trainingData(:,2:end));
Load YOLOv2 Detector for Detection
Load the detector containing the layerGraph for trainining.
vehicleDetector = load('yolov2VehicleDetector.mat');
detector = vehicleDetector.detector;
Evaluate and Plot the Miss Rate Results
Run the detector with imageDatastore.
results = detect(detector,imds);
Evaluate the results against the ground truth data using the evaluateObjectDetection function. Specify the AdditionalMetrics="LAMR" name-value argument to include miss rate and false positives per image (FPPI) in the returned metrics.
metrics = evaluateObjectDetection(results,blds,AdditionalMetrics="LAMR");Plot the log-miss-rate/FPPI curve.
figure;
loglog(metrics.ClassMetrics.FPPI{1}, metrics.ClassMetrics.MR{1});
grid on
title(sprintf('Log Average Miss Rate = %.1f', metrics.ClassMetrics.LAMR{1}))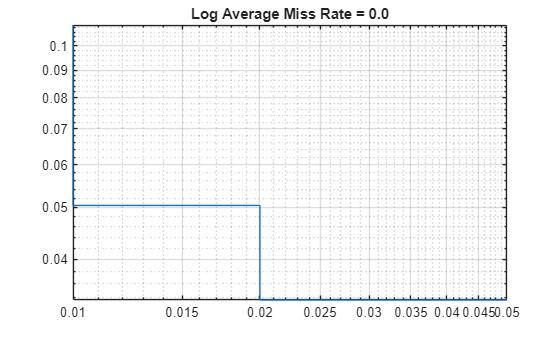
Define ground truth bounding boxes in two images corresponding to a vehicle class. Each row defines a rotated bounding box of the form [xcenter, ycenter, width, height, yaw].
gtbbox_img1 = [
    2 2 10 20 45
    80 80 30 40 15
    ];

gtbbox_img2 = [
    4 4 20 40 90
    160 160 60 80 30
    ];

gtlabel = ["vehicle"
           "vehicle"
           ];
gtlabel = categorical(gtlabel);
Create a table to hold the ground truth data. Each row in the table shows ground truth boxes and labels for one image.
groundTruthData = table({gtbbox_img1;gtbbox_img2},{gtlabel;gtlabel},'VariableNames',{'Boxes','Lables'})groundTruthData=2×2 table
Boxes Lables
____________ _________________
{2×5 double} {2×1 categorical}
{2×5 double} {2×1 categorical}
For each image, define detection results for rotated bounding boxes, scores, and labels.
bbox_img1 = [
    4 4 10 20 20
    50 50 30 10 30
    90 90 40 50 10 ];

bbox_img2 = [
    8 8 20 40 40
    100 100 60 20 60
    180 180 80 100 20 ];

scores = [0.9 0.7 0.8]';

labels = [
    "vehicle"
    "vehicle"
    "vehicle"
    ];
labels = categorical(labels,"vehicle");
Create a table to hold the detection results. Each row in the table shows detected boxes,scores and labels for one image
detectionResults = table({bbox_img1;bbox_img2},...
    {labels;labels},...
{scores;scores},'VariableNames',{'Boxes','Labels','Scores'})detectionResults=2×3 table
Boxes Labels Scores
____________ _________________ ____________
{3×5 double} {3×1 categorical} {3×1 double}
{3×5 double} {3×1 categorical} {3×1 double}
Evaluate the results against the ground truth data using the evaluateObjectDetection function. Specify the AdditionalMetrics="AOS" name-value argument to include average orientation similarity (AOS) in the returned metrics.
metrics = evaluateObjectDetection(detectionResults,groundTruthData,AdditionalMetrics="AOS");Display average orientation similarity (AOS) for each class averaged over all the specified overlap thresholds.
meanAOSOverAllOverlaps = metrics.ClassMetrics.AOSOverlapAvg
meanAOSOverAllOverlaps =
0.2600
Display orientation similarity vector for each class.
orientationSimilarity = metrics.ClassMetrics.OrientationSimilarity
orientationSimilarity = 1×1 cell array
    {[1 0.9532 0.4766 0.3177 0.2383 0.1906 0.1589]}
Input Arguments
Name-Value Arguments
Output Arguments
More About
Tips
To get started with evaluating object detector performance using various metrics such as precision-recall, average precision, and confusion matrix, see Evaluate Object Detector Performance.
To evaluate model performance across different levels of localization accuracy and fine-tune an object detector, compute metrics at multiple overlap (IoU) thresholds. Overlap thresholds vary typically from 0.5 to 0.95 during evaluation. For example, set the overlap threshold value to 0.5 to accept moderate overlap accuracy, and set the value to 0.95 to ensure very high localization accuracy. There are many ways to use the overlap threshold to tune object detector performance.
By evaluating common metrics, such as precision and recall, at different overlap thresholds, you can evaluate the tradeoff between detecting more objects (higher recall) and ensuring those detections are accurate (higher precision).
By evaluating model performance at a lower overlap threshold, such as 0.5, and at higher thresholds, such as 0.95, you can determine how good the detector is at identifying objects (detection) at the expense of precise localization (bounding box accuracy).
By computing metrics such as the mean average precision (mAP) over multiple overlap thresholds, you can produce a single performance figure that accounts for both detection and localization accuracy, enabling you to compare different detection models.
To learn how to compute metrics at a range of overlap thresholds to tune detector performance, see the "Precision and Recall for a Single Class" section of the Multiclass Object Detection Using YOLO v2 Deep Learning example.
Version History
Introduced in R2023bSee Also
Apps
Functions
objectDetectionMetrics|yoloxObjectDetector|yolov4ObjectDetector|yolov3ObjectDetector|yolov2ObjectDetector|ssdObjectDetector|boxLabelDatastore
Topics
- Get Started with Object Detector Analyzer
- Multiclass Object Detection Using YOLO v2 Deep Learning
- Object Detection in Large Satellite Imagery Using Deep Learning
- Detect Small Objects Using Tiled Training of YOLOX Network
- Evaluate Object Detector Performance
- Calibrate Object Detection Confidence Scores
- Get Started with Object Detection Using Deep Learning
- Choose an Object Detector