evaluateDetectionMissRate
(To be removed) Evaluate miss rate metric for object detection
evaluateDetectionMissRate will be removed in a future release. Use
evaluateObjectDetection instead.
Syntax
Description
logAverageMissRate = evaluateDetectionMissRate(detectionResults,groundTruthData)detectionResults
compared to groundTruthData, which is used to measure the
performance of the object detector. For a multiclass detector, the log-average
miss rate is a vector of scores for each object class in the order specified by
groundTruthData.
[ returns data points for
plotting the log miss rate–false positives per image (FPPI) curve, using input
arguments from the previous syntax.logAverageMissRate,fppi,missRate]
= evaluateDetectionMissRate(___)
[___] = evaluateDetectionMissRate(___, specifies
the overlap threshold for assigning a detection to a ground truth
box.threshold)
Input Arguments
Object locations and scores, specified as a two-column table containing the bounding boxes and scores for each detected object. For multiclass detection, a third column contains the predicted label for each detection. The bounding boxes must be stored in an M-by-4 cell array. The scores must be stored in an M-by-1 cell array, and the labels must be stored as a categorical vector.
When detecting objects, you can create the detection results table by
using imageDatastore.
        ds = imageDatastore(stopSigns.imageFilename);
        detectionResults = detect(detector,ds);
Data Types: table
Labeled ground truth, specified as a datastore or a table.
Each bounding box must be in the format [x y width height].
Datastore — A datastore whose
readandreadallfunctions return a cell array or a table with at least two columns of bounding box and labels cell vectors. The bounding boxes must be in a cell array of M-by-4 matrices in the format [x,y,width,height]. The datastore'sreadandreadallfunctions must return one of the formats:{boxes,labels} — The
boxLabelDatastorecreates this type of datastore.{images,boxes,labels} — A combined datastore. For example, using
combine(imds,blds).
See
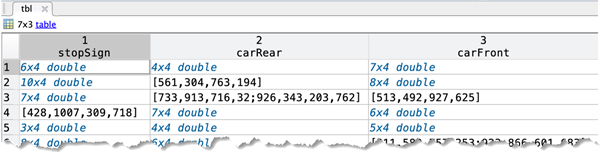
boxLabelDatastore.Table — One or more columns. All columns contain bounding boxes. Each column must be a cell vector that contains M-by-4 matrices that represent a single object class, such as stopSign, carRear, or carFront. The columns contain 4-element double arrays of M bounding boxes in the format [x,y,width,height]. The format specifies the upper-left corner location and size of the bounding box in the corresponding image.
Overlap threshold for a detection assigned to a ground truth box, specified as a numeric scalar. The overlap ratio is computed as the intersection over union.