Simulation Diagnostics
SoC Blockset™ enables simulation and evaluation of memory transactions in Simulink® without the need to deploy a model to an SoC device. Use this diagnostic information to analyze the performance of your models, and adjust as needed to meet the desired system performance requirements. The simulation generates two types of visualization of the memory traffic:
Simulation Performance Plots – Provides high level performance diagnostics of the model's memory system. Memory bandwidth, burst counts, and transaction latencies are calculated from a simulation of your model. You can view this information for each memory initiator in your model, or an overall view from the memory controller.
Buffer and Burst Waveforms – Provides burst transaction debug information from simulation, including the use of buffer regions.
You can also capture actual bandwidth, number of bursts, and latency measurements from the design running on the FPGA, and view information about individual burst transactions. This information is captured by including an AXI interconnect monitor IP in the FPGA design, and querying the data over a JTAG AXI manager connection from the host. See Memory Performance Information from FPGA Execution.
Buffer and Burst Waveforms
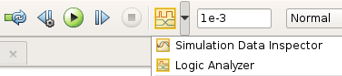
SoC Blockset enables logging simulation signals and visualizing the logged signals using the Logic Analyzer. To enable signal logging, expand the Prepare section in the toolstrip, and select Profile Memory.
After simulating your model, locate the Logic Analyzer at the top of your Simulink window.
The Logic Analyzer tool provides visualization of signal waveforms to show timing of various events in the memory model.
The Logic Analyzer displays signals from the Memory Controller and from the memory blocks.
Burst Waveforms
Waveforms from the memory controller include information for bursts from the initiators in the system. The waveforms are color coded to differentiate the different initiators. These waveforms give insight into the sequencing of each of the initiators through the shared memory. For each initiator, view the following signals:
BURST_EXECUTION_EVENT: State of the current burst request. Valid states are:BurstIdle,BurstRequest,BurstAccepted,BurstExecuting,BurstDone,BurstComplete. For more information about the memory controller state, see Memory Controller.ReqID: Identifier of the current burst request. This ID is an incrementing number that is unique throughout simulation.burstTransfersCompleted: A running count of transferred bursts. If no bursts are dropped within the memory channel, the count of transferred bursts matchesReqID. If bursts are dropped,ReqIDbecomes larger than this count.BytesTransferred: A running count of transferred bytes.
The following figure shows the signals after simulation of the model in Analyze Memory Bandwidth Using Traffic Generators.

The waveforms include burst information for the four initiators, displayed in different colors. This information correlates to the Memory Controller Latency Plots.
Burst Waveforms with Hidden Memory Controller
When simulating with one of these blocks, the memory controller is hidden in the model:
Memory Traffic Generator with the Show Memory Controller Ports parameter cleared.
The waveforms from this model include the burst signals, and in addition a signal named
masterID. ThemasterIDsignal is automatically assigned, and it remains constant throughout the simulation. It identifies the master connected to the memory controller.The following figure shows the signals after simulation of the model in Analyze Memory Bandwidth Using Traffic Generators, when the Memory Controller block is removed, and the Show Memory Controller Ports parameter is cleared in each Memory Traffic Generator block.

Buffer Waveforms
Waveforms from the memory channel include information for buffer read and write transactions in the channel. Each memory region is divided into several buffers specified by the Number of buffers parameter of the memory block. The writer fills the buffers, and the reader empties them. These waveforms give insight into the sequencing of the writer and reader for a given region. The buffer waveforms include the following signals:
REGION_BUFFER_EVENT: State of the current buffer request. Valid states are: none (idle), request, executing, done. For more information about the state of the memory channel.BufReqID: Identifier of the current buffer request. This ID is an incrementing number that is unique throughout simulation.BufGntCurrentBuf: The currently active buffer specified from 1 to the number of buffers in the channel.BufGntCurrentBufpoints to the buffer being written to (on the writer side), or the buffer being read from (on the reader side).BufRelCurrentBuf: The buffer currently released by the reader or writer specified from 1 to the number of buffers in the channel. On the reader side, when a buffer is released, it is available to the writer for writing. On the writer side, when a buffer is released, it is available to the reader for reading.BufAvail: The number of buffers currently available to the reader for reading. This value is identical on the reader and the writer side.BufTransfersCompleted: A running count of transferred buffers. If no buffers are dropped within the memory region, the count of transferred buffers matchesBufReqID. If buffers are dropped,BufReqIDis larger than this count.icFIFOEntries: Number of bursts written to the interconnect FIFO.icFIFODroppedCount: Number of bursts dropped from the interconnect FIFO.
The following figure shows the buffer signals after simulation of the model in Histogram Equalization Using Video Frame Buffer.

See Also
Performance Report | Logic Analyzer | Memory Channel | Memory Controller