Visualize Live Simulation Results in Deployed Applications
R2026bThis example shows how to develop, run, and deploy an simulation app that tunes parameters, processes outputs, and visualizes results during simulation. The app simulates a model of the Lorenz system. These two functions define the core functionality of the app:
createSimulationInputsets up the simulation and configures the app for deployment support.postStepFcnreads and processes output data then plots results after each time step in the simulation.
Open Lorenz System Simulation App
Open the app LorenzSystemApp. The interface includes edit fields for specifying parameter values, a button that starts and stops the simulation, and a plot that displays live simulation results during the simulation.
LorenzSystemApp
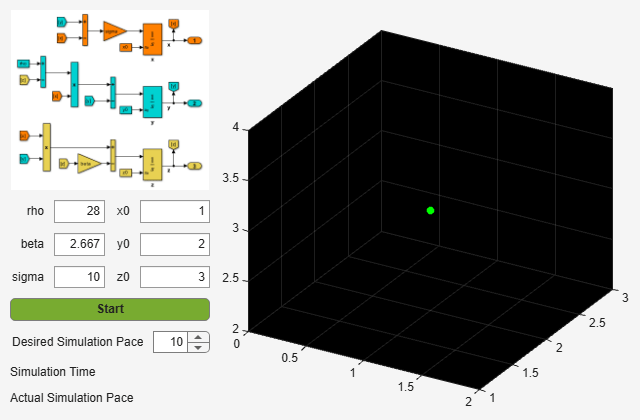
To view the implementation of the app, open the file LorenzSystemApp.mlapp. The App Designer displays the design view by default. To view the code for the app, select the Code View tab.
edit LorenzSystemApp.mlapp
For information about creating apps using the App Designer, see Create and Run a Simple App Using App Designer.
Configure Simulation Using Simulink.SimulationInput Object
When you start a simulation by clicking the Start button, the app calls the createSimulationInput function. The function creates and configures the Simulink.SimulationInput object used to run the simulation. The Simulink.SimulationInput object:
Registers the callback function that updates the start button text and behavior based on the simulation status.
Registers the post step callback function that processes data from top-level output ports in each time step and plots live simulation results
Passes variable values from the app to the simulation
Configures the
Simulink.SimulationInputobject for deployment.
Configuring the app for deployment might slow down debugging. To speed up debugging, comment the line that calls simulink.compiler.configureForDeployment.
function simInp = createSimulationInput(app)
            simInp = Simulink.SimulationInput('LorenzSystemModel');

            simInp = simulink.compiler.setSimulationStatusChangeFcn(simInp, ...
                @(simStatus) app.simStatusChangedFcn(simStatus));

            simInp = simulink.compiler.setPostStepFcn(simInp, ...
                @(simTime) app.postStepFcn(simTime), ...
                'Decimation',app.postStepFcnDecimation);

            simInp = simInp.setVariable('rho',app.rhoUIC.Value);
            simInp = simInp.setVariable('beta',app.betaUIC.Value);
            simInp = simInp.setVariable('sigma',app.sigmaUIC.Value);
            simInp = simInp.setVariable('x0',app.x0UIC.Value);
            simInp = simInp.setVariable('y0',app.y0UIC.Value);
            simInp = simInp.setVariable('z0',app.z0UIC.Value);

            simInp = simulink.compiler.configureForDeployment(simInp);
end
Read and Process Output Data
To process and visualize live simulation results, the Simulink.SimulationInput object registers a post step callback function. The post step function executes after each time step. The post step function in the Lorenz system app:
Updates the simulation time and pace displayed in the app
Gets the latest values of the outputs
x,y, andzAdds the latest values to the plot in the app
function postStepFcn(app, simTime)
            app.SimTime.Text = sprintf('%0.5g',simTime); % 0.1234e+56
            wcTime = toc(app.wallClockTimeAtSimStart);
            app.SimPace.Text = sprintf('%7.2f', simTime/wcTime); % 1234.56
            app.adjustPostStepFcnDecimation();
            simOut = simulink.compiler.getSimulationOutput(app.modelName);
            ts = simulink.compiler.internal.extractTimeseriesFromDataset(simOut.yout);
            xv = []; yv = []; zv = [];
                for its = 1:length(ts)
                    idx = find(ts{its}.Time >= app.simTimeAtLastPostStep);
                    switch ts{its}.Name
                        case 'x'
                            xv = ts{its}.Data(idx);
                        case 'y'
                            yv = ts{its}.Data(idx);
                        case 'z'
                            zv = ts{its}.Data(idx);
                    end
                end
            addpoints(app.hLine,xv,yv,zv);
            [xv, yv, zv] = getpoints(app.hLine);
            set(app.hTail,'XData',xv(1),'YData',yv(1),'ZData',zv(1));
            set(app.hHead,'XData',xv(end),'YData',yv(end),'ZData',zv(end));
            drawnow limitrate;
            app.simTimeAtLastPostStep = simTime;
end
Deploy App
Before deploying the application, confirm that the app runs as expected. In the App Designer, click Run. Then, in the app, click Start. The app starts the simulation and plots live results. Once you confirm that the simulation produces expected results, stop the simulation by clicking Stop.
To support deployment, a simulation app must configure Simulink.SimulationInput objects for deployment using the simulink.compiler.configureForDeployment function. In the Lorenz system app, the createSimulationInput function configures the Simulink.SimulationInput object for deployment.
To compile and deploy the app, use the mcc command.
mcc -m LorenzSystemApp
See Also
configureForDeployment | mcc | Simulink.SimulationInput | mcc | simulink.compiler.setPostStepFcn | sim | simulink.compiler.genapp

