Examine Model Dynamics Using Solver Profiler
When model simulation slows down or stops responding, a close examination of the dynamics of the model can help you identify the factors affecting the simulation.
Understanding solver behavior enables you to interpret how the model simulates and what causes the solver to take small steps.
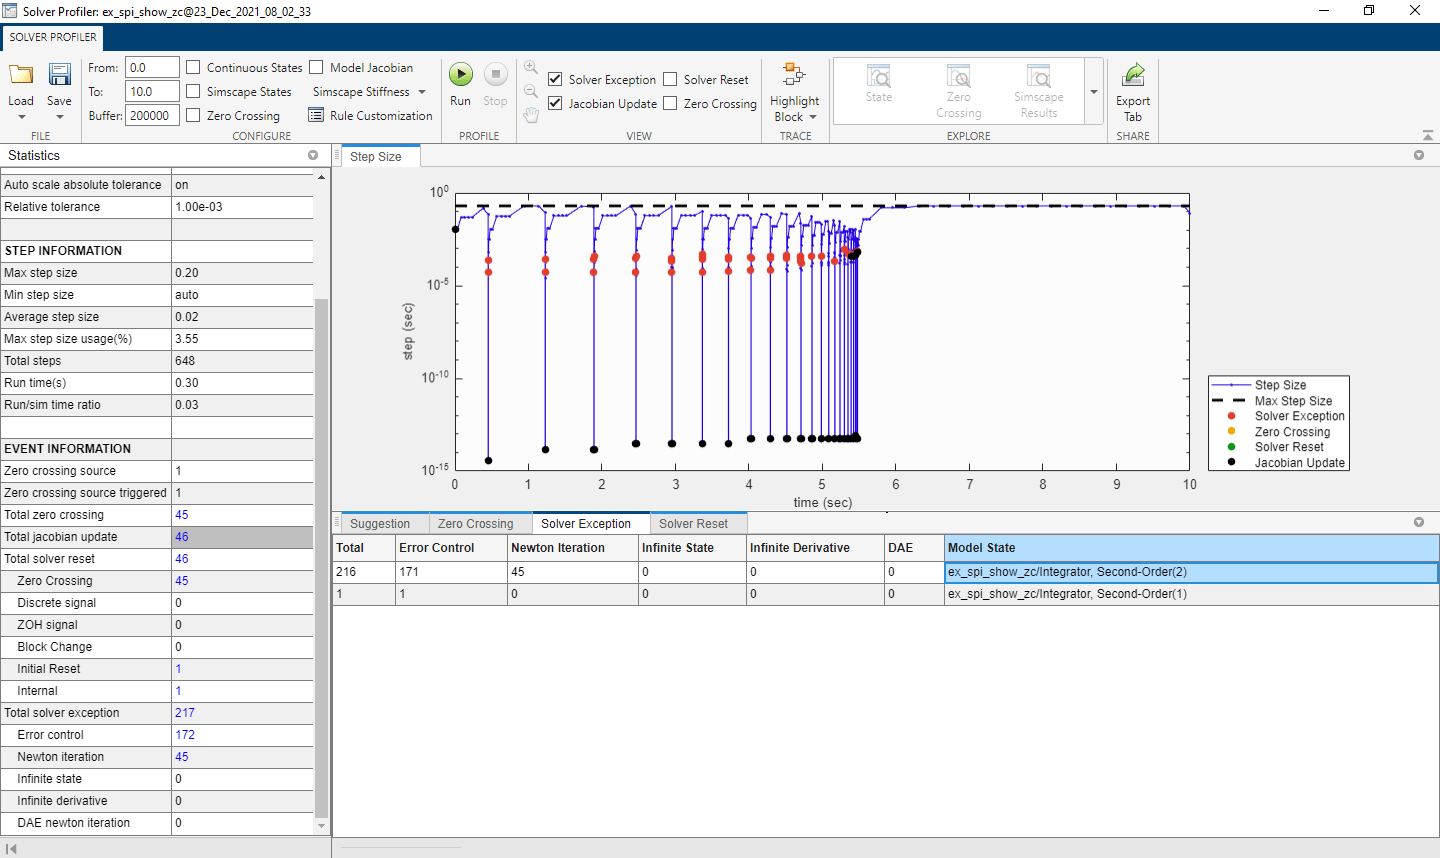
The Solver Profiler analyzes a model for patterns that affect its simulation. The Solver Profiler presents graphical and statistical information about the simulation, solver settings, events, and errors. You can use this data to locate blocks causing simulation bottlenecks.
In addition, there are multiple factors that can limit the simulation speed. The Solver Profiler logs and reports all the major events that occur when simulating a model:
Zero-crossing events
Solver exception events
Solver reset events
Jacobian computation events
While these events may improve simulation fidelity, they also contribute to greater computational cost. You can use the Solver Profiler to find an acceptable balance between fidelity and performance. Consider simplifying or replacing blocks that impact performance but do not meaningfully contribute to fidelity.
Note
To accurately profile the solver performance, the Solver Profiler may temporarily modify some logging settings of your model. The Solver Profiler restores your settings once it completes the profile.
To examine model dynamics and identify causes that affect the simulation:
Open the model that is simulating slowly or unsuccessfully. For example, open the
BouncingBallWithSwitchmodel.
Open the Solver Profiler by clicking the hyperlink in the lower-right corner of the Simulink® Editor.

The Solver Profiler provides smart logging and diagnostics of continuous model states and Simscape™ states. To enable this, select the Continuous States, Zero Crossing or Simscape States option before a run. Disable these options only if you are running out of memory. After the run, access the States Explorer, Zero Crossing Explorer, or Simscape Explorer to examine those states.
Click Run. The profiler simulates the model and starts capturing solver performance data.
When the simulation ends, the profiler displays the statistics and exceptions it captured over the duration of the simulation.
Tip
You can pause or stop the simulation at any time to view the information captured until that point.
Use the profiler plot to highlight the parts of the model that generate the most events.
Click Save to capture your profiling session, or exit without saving.
See Also
Solver Profiler | Zero Crossing Explorer | State Explorer | solverprofiler.profileModel