Zero Crossing Explorer
View and explore zero-crossing events that occur in profiling simulations run using Solver Profiler
Description
Use the Zero Crossing Explorer to visualize and analyze zero crossing events that occur during profiling simulations you run using the Solver Profiler.

Open the Zero Crossing Explorer
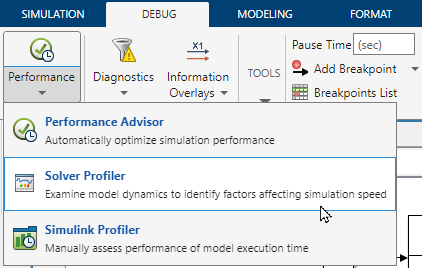
Open the Solver Profiler. In the Simulink® Toolstrip, on the Debug tab, click the Performance button arrow and select Solver Profiler.

In the Solver Profiler, select Zero Crossing and click Run to run a profiling simulation that saves data about zero-crossing events.
After the profiling simulation completes, in the Solver Profiler, in the Explore section, select Zero Crossing.
Examples
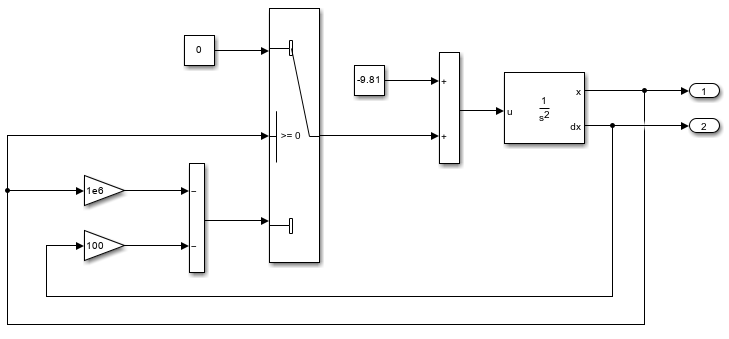
Open the example, which contains a model named BouncingBallWithSwitch.
Open the Solver Profiler. In the Simulink® Toolstrip, on the Debug tab, in the Performance section, click the Performance button arrow and select Solver Profiler.
Configure the Solver Profiler to save data about zero-crossing events that occur during the profiling simulation. In the Solver Profiler, in the Configure section, select Zero Crossing. Then, to run the profiling simulation, click Run.
After the profiling simulation completes, open the Zero Crossing Explorer. In the Solver Profiler, in the Explore section, click Zero Crossing. The Zero Crossing Explorer shows a list of the zero-crossing signals in the model on the left and two plots that display information about the selected zero-crossing signal on the right. The top plot shows the signal value throughout the profiling simulation, with red dots that indicate each zero-crossing event. The bottom plot is a bar graph that shows the density of zero-crossing events throughout the profiling simulation.
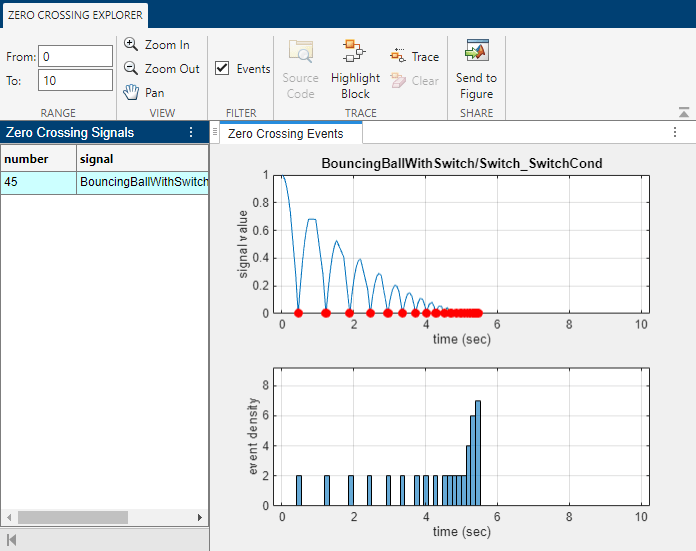
The density of the zero-crossing events increases between approximately 5 and 5.5 seconds, as the ball approaches rest. Zoom the plots to view the zero-crossing signal and zero-crossing event density more closely in this time range. In the Zero Crossing Explorer, in the View section, click Zoom In. Then, click and hold while selecting the region of the plot to view.
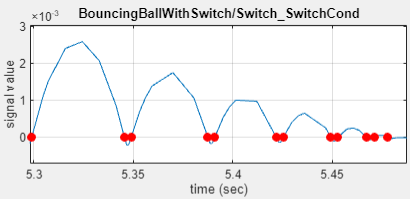
After you zoom, you can see that each bounce creates two zero-crossing events. First, the signal crosses from positive to negative. Then, the signal crosses from negative to positive. The double zero crossings are an artifact of numerically solving systems in which states approach zero. When the ball comes to rest at approximately 5.5 seconds, the second zero-crossing event, when the signal crosses from negative to positive, does not occur.
Related Examples
Tips
When you want to analyze and improve simulation performance, consider starting the analysis by analyzing your model and simulation configuration using the Performance Advisor.
After analyzing the model and simulation configuration using the Performance Advisor, you can perform deeper analysis by profiling simulations using the Solver Profiler and the Simulink Profiler.
The Solver Profiler analyzes the performance of the selected solver for the model and can be particularly helpful for analyzing the performance of simulations that use variable-step solvers. The profiling results help you identify when and why the step size is limited.
The Simulink Profiler helps you identify bottlenecks for simulation performance by analyzing the distribution of simulation execution time among model components.
Version History
Introduced in R2019a