State Explorer
View and analyze continuous state and continuous state derivative values in profiling simulations run using Solver Profiler
Description
Use the State Explorer to analyze the dynamics of states and state derivatives in your model.

Open the State Explorer
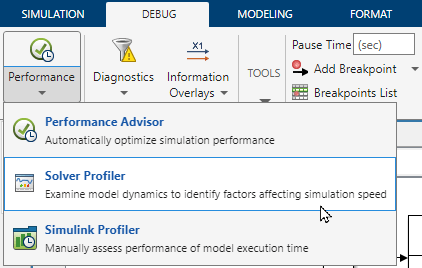
Open the Solver Profiler. In the Simulink® Toolstrip, on the Debug tab, click the Performance button arrow and select Solver Profiler.

In the Solver Profiler, select Continuous States and click Run to run a profiling simulation that saves data about continuous states.
After the profiling simulation completes, in the Solver Profiler, in the Explore section, select State.
Examples
Open the example, which contains a model named BouncingBallWithSwitch.
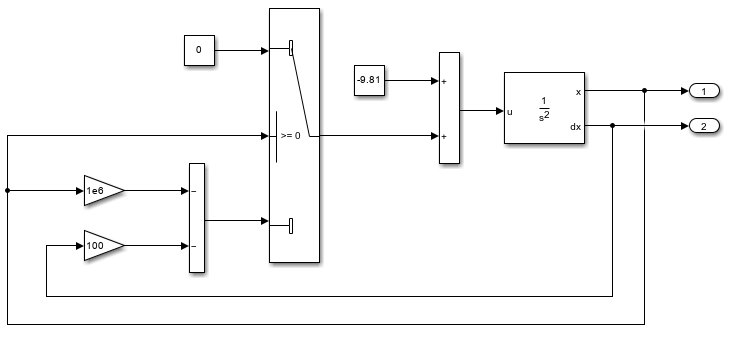
Open the Solver Profiler. In the Simulink® Toolstrip, on the Debug tab, in the Performance section, click the Performance button arrow and select Solver Profiler.
Configure the Solver Profiler to save data about continuous states. In the Solver Profiler, in the Configure section, select Continuous States. Then, to run the profiling simulation, click Run.
After the profiling simulation completes, open the State Explorer. In the Solver Profiler, in the Explore section, click State. The State Explorer shows a list of the states in the model on the left and plots that show the value and the derivative value of the selected state over the course of the profiling simulation.
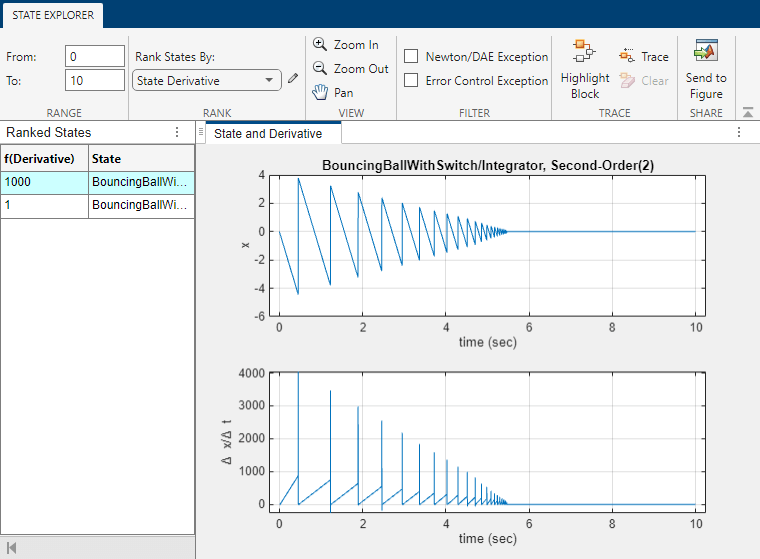
In the State Explorer, in the Filter section, select Newton/DAE Exception. The Solver Profiler annotates the plots with red dots on each simulation time at which a Newton exception occurred. The Newton exceptions happen more frequently as the ball approaches rest.
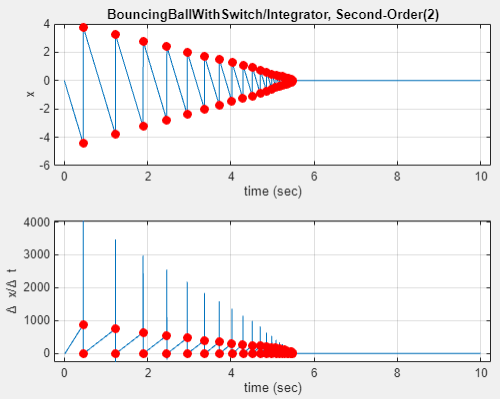
To investigate the frequency of Newton exceptions as the ball approaches rest, zoom the plots to view the state and derivative values between approximately 5 and 5.5 seconds. In the View section, select Zoom In. Then, click and hold while selecting the region of the plot to view.
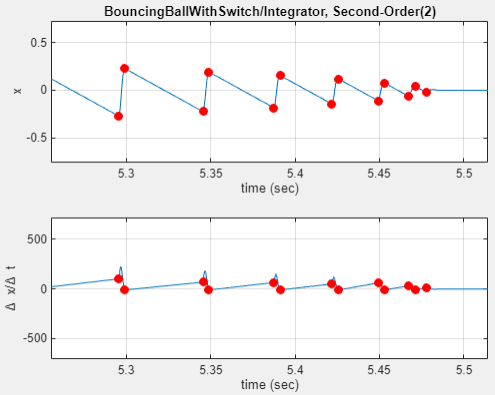
Each bounce of the ball causes two Newton iterations to switch from positive to negative, corresponding to two zero-crossing events. The ball comes to rest between 5.45 and 5.5 seconds, with a single, last Newton exception.
Tips
When you want to analyze and improve simulation performance, consider starting the analysis by analyzing your model and simulation configuration using the Performance Advisor.
After analyzing the model and simulation configuration using the Performance Advisor, you can perform deeper analysis by profiling simulations using the Solver Profiler and the Simulink Profiler.
The Solver Profiler analyzes the performance of the selected solver for the model and can be particularly helpful for analyzing the performance of simulations that use variable-step solvers. The profiling results help you identify when and why the step size is limited.
The Simulink Profiler helps you identify bottlenecks for simulation performance by analyzing the distribution of simulation execution time among model components.
Version History
Introduced in R2016a