Main Content

radarmetricplot

Plot radar performance metric against target range

Since R2021a

Description

radarmetricplot(range,metric) plots a radar performance metric metric as a function of the target range range. The input range is a length-J vector of target ranges. The input metric is a J-by-K matrix of the performance metric values for K radar systems computed at the target ranges in range.

example

radarmetricplot(range,metric,objective) also plots the objective requirement objective on the radar performance metric.

radarmetricplot(range,metric,objective,threshold) also plots the threshold requirement threshold on the radar performance metric.

example

radarmetricplot(___,Name,Value) specifies additional Name,Value arguments.

Example: 'MaxRangeRequirement',125e3,'MetricName','Available SNR' specifies the maximum range requirement to be 125000 m, and the metric name to be 'Available SNR'

h = radarmetricplot(___) returns the handle to the axes in the figure.

Examples

collapse all

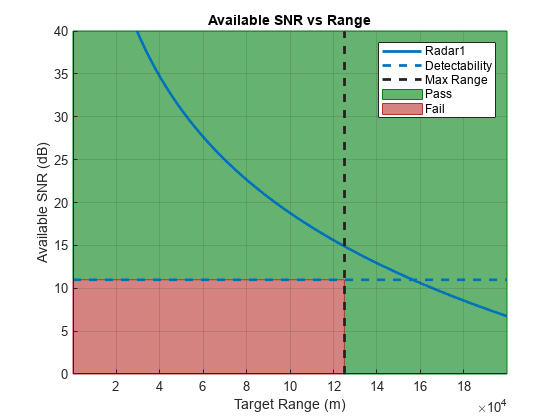
For a radar system, plot the available SNR and the detectability factor against the target range. Mark the required maximum range. Use the stoplight chart to assess the detection performance of the system at different ranges.

Scenario Parameters

Define the scenario parameters.

lambda = freq2wavelen(3e9);            % Wavelength (m)
Pt = 5e3;                              % Peak power (W)
tau = 1.2e-5;                          % Pulse width (s)
N = 24;                                % Number of received pulses
SwerlingCase = 'Swerling1';            % Swerling case
G = 40;                                % Antenna gain (dB)
Pfa = 1e-6;                            % Pfa

Requirements

Specify the probability of detection to be 0.9 and the maximum range to be 125000 m.

Pd = 0.9;                              % Required Pd
MaxRangeRq = 125e3;                    % Maximum range requirement (m)

Specify the range points to evaluate the radar equation.

R = (1:1e2:200e3).';

Compute Performance Metric and Requirement

Compute the available SNR and the detectability factor.

Compute the available SNR from the radar equation using the radareqsnr function.

SNRav = radareqsnr(lambda,R,Pt,tau,'Gain',G);

Compute the detectability factor using the detectability function.

DxObj = detectability(Pd,Pfa,N,SwerlingCase)
DxObj = 10.9850

Plot Performance Metric and Requirement

Plot the available SNR in dB and the detectability factor against the target range using the radarmetricplot function. In order to plot, specify the 'MaxRangeRequirement' to be 125000 m. Set 'ShowStoplight' to true to show a stoplight chart that color codes the area of the plot according to the specified requirements.

radarmetricplot(R,SNRav,DxObj,'MaxRangeRequirement',MaxRangeRq, ...
    'MetricName','Available SNR','MetricUnit','dB',...
    'RequirementName','Detectability','ShowStoplight',true)
ylim([0 40])

Input Arguments

collapse all

Target ranges at which the metric is computed, specified as a length-J column vector, where J is the number of target ranges.

Data Types: double

Radar performance metric values, specified as a J-by-K matrix, where J is the length of the target range vector range and K is the number of radars.

Data Types: double

Objective requirement, specified as one of the following:

  • scalar –– The objective requirement is assumed to be constant across all ranges in range and equal for all K radars.

  • 1-by-K vector –– The objective requirement is specified for each radar and is assumed to be constant for all ranges in range.

  • J-by-1 vector –– The objective requirement is specified for each range in range and is assumed to be equal for all K radars.

  • J-by-K matrix –– The objective requirement is specified for each range in range and for each radar.

Data Types: double

Threshold requirement, specified as one of the following:

  • scalar –– The threshold requirement is assumed to be constant across all ranges in range and equal for all K radars.

  • 1-by-K vector –– The threshold requirement is specified for each radar and is assumed to be constant for all ranges in range.

  • J-by-1 vector –– The threshold requirement is specified for each range in range and is assumed to be equal for all K radars.

  • J-by-K matrix –– The threshold requirement is specified for each range in range and for each radar.

Data Types: double

Name-Value Arguments

Specify optional pairs of arguments as Name1=Value1,...,NameN=ValueN, where Name is the argument name and Value is the corresponding value. Name-value arguments must appear after other arguments, but the order of the pairs does not matter.

Before R2021a, use commas to separate each name and value, and enclose Name in quotes.

Example: 'MaxRangeRequirement',125e3,'MetricName','Available SNR' specifies the maximum range requirement to be 125000 m, and the metric name to be 'Available SNR'

Maximum range requirement, specified as one of the following:

  • scalar –– Specifies the objective requirement on the maximum range.

  • two-element vector –– Specifies both the objective and the threshold requirements in the [objective threshold] format.

Data Types: double

Specify whether to show the stoplight chart that color codes the area of the plot according to the specified requirements, specified as a logical scalar value.

If you only specify objective, the function divides the area of the plot into two colored zones along the metric axis. To satisfy the requirement, the function by default assumes that the metric must be greater than or equal to the objective. In this case, the area above objective is marked Pass and is colored green, while the area below objective is marked Fail and is colored red.

To indicate the opposite case when the metric must be below the objective to satisfy the requirement, specify the threshold input explicitly as Inf. On the resultant stoplight chart, the objective requirement is satisfied at the ranges where the metric curve is in the Pass zone. At the ranges where the curve passes through the Fail zone, the system violates the objective requirement.

If you specify a finite threshold, the area between objective and threshold is colored yellow and marked Warn. At the ranges where the metric passes through the Warn zone, the objective requirement is violated, while the threshold requirement is still satisfied. The stoplight chart can be displayed only when the same requirements are specified for all radars (objective and threshold are scalars or length-J column vectors). Otherwise, this name-value pair is ignored.

The value of the 'MaxRangeRequirement' name-value pair limits the Fail and the Warn zones along the range axis. Both the Fail and the Warn zones extend to the objective value of the maximum range requirement when only the objective is provided. If both the objective and the threshold requirements are specified, the Fail zone extends to the threshold requirement while the Warn zone extends to the objective.

Data Types: logical

Names of the radar systems, specified as a length-K cell array of character vectors or a string array, where K is the number of radars. The radar names are used to augment the corresponding legend entries. When not specified, the default name 'Radark' is used for the kth radar system.

Data Types: string | char | cell

Name of radar performance metric, specified as a character vector or a string scalar. When not specified, the default name 'Metric' is used.

Data Types: char | string

Name of requirement, specified as a character vector or a string scalar. When not specified, the function uses the default name 'Requirement'.

Data Types: char | string

Units for range values in vector range and for the value of 'MaxRangeRequirement', specified as one of the following:

  • 'm' –– Meters

  • 'km' –– Kilometers

  • 'mi' –– Miles

  • 'nmi' –– Nautical mile

  • 'ft' –– Feet

Units for metric values, specified as a character vector or a string scalar.

Data Types: char | string

Handle to plot axes, specified as an Axes object. The default value is the current axes, which can be specified using gca.

Output Arguments

collapse all

Handle to the axes displayed in the figure, returned as an Axes object.

More About

collapse all

Stoplight Chart

A radar system must meet a set of performance requirements that depend on the environment and scenarios in which the system is intended to operate. A number of such requirements can be fairly large and a design that satisfies all of them might be impractical. In this case a tradeoff analysis is applied. A subset of the requirements is satisfied at the expense of accepting lower values for the rest of the metrics. Such tradeoff analysis can be facilitated by specifying multiple requirement values for a single metric.

The requirement for each metric is specified as a pair of values:

  • Objective — The desired level of the performance metric

  • Threshold — The value of the metric below which the system's performance is considered unsatisfactory

The region between the Threshold and the Objective values is the trade-space. It defines a margin by which a metric can be below the Objective value while the system is still considered to have a satisfactory performance.

A stoplight chart color-codes the status of the performance metric for a radar system based on the specified requirements. The plot is divided into three zones:

  • A Pass zone, colored green — At the ranges where the curve is in the Pass zone, the system performance satisfies the Objective value of the requirement.

  • A Warn zone, colored yellow — At the ranges where the curve passes through the Warn zone, the system performance violates the Objective value of the specified requirement but still satisfies the Threshold value.

  • A Fail zone, colored red — At the ranges where the curve passes through the Fail zone, the system performance violates the Threshold value of the specified requirement.

References

[1] Charles S. Wasson. System engineering analysis, design, and development: Concepts, principles, and practices. John Wiley & Sons, 2015.

Extended Capabilities

C/C++ Code Generation
Generate C and C++ code using MATLAB® Coder™.

Version History

Introduced in R2021a