Main Content

rendererinfo

Graphics renderer information

Description

example

info = rendererinfo returns a structure containing the default renderer information for the current MATLAB® session.

example

info = rendererinfo(target) returns a structure containing the renderer information for the target graphics object. Specify target as any type of axes or a standalone visualization. You can also specify an array of n axes or standalone visualizations, in which case info is returned as a 1-by-n structure array.

Examples

collapse all

Get the default renderer information for the current session.

info = rendererinfo
info = struct with fields:
    GraphicsRenderer: 'OpenGL Software'
              Vendor: 'Brian Paul'
             Version: '2.1 Mesa 17.1.3'
      RendererDevice: 'Mesa X11'
             Details: [1x1 struct]

Create a surface plot of the peaks function.

surf(peaks)

Surface plot of the peaks function

Get the current axes, and then get renderer information for the axes. Your system might return different information.

ax = gca;
info = rendererinfo(ax)
info = 

  struct with fields:

    GraphicsRenderer: 'OpenGL Hardware'
              Vendor: 'NVIDIA Corporation'
             Version: '4.6.0 NVIDIA 391.58'
      RendererDevice: 'Quadro P600/PCIe/SSE2'
             Details: [1×1 struct]

Get the driver details.

info.Details
ans = 

  struct with fields:

           RendererDriverVersion: '23.21.13.9174'
       RendererDriverReleaseDate: '2018-6-4'
            HardwareSupportLevel: 'Full'
    SupportsDepthPeelTransparency: 1
       SupportsAlignVertexCenters: 1
       SupportsGraphicsSmoothing: 1
                  MaxTextureSize: 32768
              MaxFrameBufferSize: 32768

Create a heatmap chart and a scatter plot in a figure.

tiledlayout(1,2)
nexttile
h = heatmap(rand(5));
ax1 = nexttile;
scatter(ax1,1:10,rand(1,10))

Heatmap chart next to a scatter plot

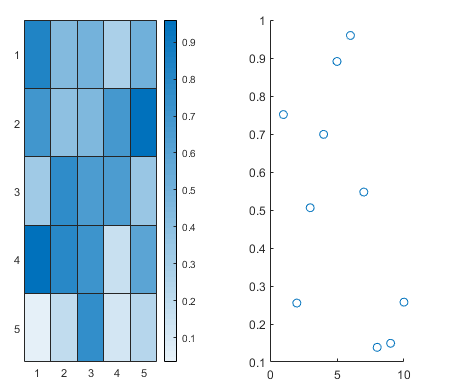
Get the renderer information for the heatmap chart and the parent axes of the scatter plot. In this case, info is an array that contains two structures.

info = rendererinfo([h ax1])
info = 

  1×2 struct array with fields:

    GraphicsRenderer
    Vendor
    Version
    RendererDevice
    Details

Index into the array to get the renderer version for the heatmap chart. Your system might return different version information.

info(1).Version
ans =

    '4.6.0 NVIDIA 391.74'

Input Arguments

collapse all

Target object, specified as one of the following:

  • Any type of axes, such as an Axes, PolarAxes, or GeographicAxes object.

  • A standalone visualization, such as a heatmap.

  • An array of axes, standalone visualizations, or a combination of them.

Output Arguments

collapse all

Renderer information, returned as a structure that contains information such as the name of the graphics renderer, vendor, and version. The Details field is a nested structure that contains additional details. Both the info structure and the info.Details structure are described in the tables below.

If you specify target as an array of n axes or standalone visualizations, info is returned as a 1-by-n structure array. Each structure in the array corresponds to an element of target.

Info Structure

All systems return these fields.

FieldDescription
GraphicsRenderer

Graphics renderer, returned as one of these values:

  • 'OpenGL Hardware'

  • 'OpenGL Software'

  • 'MathWorks Painters'

  • 'WebGL'

Vendor

Manufacturer of the graphics renderer implementation.

Version

Version of the graphics renderer implementation.

RendererDevice

Device that supports the graphics renderer. If you are using hardware-accelerated graphics, this field is the graphics card model name.

Details

Nested structure that contains additional details, such as the renderer's driver version. For the Painters renderer, this structure is empty.

Details Structure

Some systems return a subset of these fields, depending on the graphics renderer. For the Painters renderer, the info.Details structure is empty.

FieldDescription
RendererDriverVersion

Version of the OpenGL® driver. This field displays only on Windows® systems running hardware-accelerated OpenGL. This field does not display on virtual machines.

RendererDriverReleaseDate

Release date of the OpenGL driver. This field displays only on Windows systems running hardware-accelerated OpenGL. This field does not display on virtual machines.

HardwareSupportLevel

Hardware support level, returned as one of these values:

  • 'Full' — MATLAB uses graphics hardware as much as possible to provide advanced graphics features. Most systems running hardware-accelerated OpenGL and WebGL™ return this value.

  • 'Basic' — MATLAB uses graphics hardware, but some features are disabled. Disabling graphics features is sometimes necessary to avoid graphics display issues.

  • 'None' — MATLAB does not use any graphics hardware. All systems running software OpenGL return this value. On some systems, software implementations of certain features might be supported.

If MATLAB detects an unsupported driver, this field also contains 'known graphics driver issues'.

SupportsDepthPeelTransparency

Depth peel transparency feature support, returned as logical(1) if supported and logical(0) otherwise.

SupportsAlignVertexCenters

Align vertex centers feature support, returned as logical(1) if supported and logical(0) otherwise.

SupportsGraphicsSmoothing

Graphics smoothing feature support, returned as logical(1) if supported and logical(0) otherwise.

MaxTextureSize

Maximum texture size that the renderer supports (in pixels).

MaxFrameBufferSize

Maximum frame buffer size that the renderer supports (in pixels).

More About

collapse all

Advanced Graphics Features

Advanced graphics features are features that require certain renderer implementations. These features are graphics smoothing, depth peel transparency, align vertex centers, and hardware-accelerated markers. You can tell whether your system supports some or all of these features by getting the value of the HardwareSupportLevel field of the info.Details structure.

This table lists the advanced graphics features and the circumstances under which they are supported. In some cases, certain features are supported, but they are disabled to avoid graphics display issues.

Graphics Feature Hardware OpenGL Basic Hardware OpenGL Software OpenGL on WindowsSoftware OpenGL on Linux® WebGL
Graphics SmoothingSupported for OpenGL 2.1 or higherSupported for OpenGL 2.1 or higherNot supportedNot supportedSupported
Depth Peel TransparencySupported for OpenGL 2.1 or higherDisabledNot supportedSupportedSupported
Align Vertex CentersSupported for OpenGL 2.1 or higherDisabledNot supportedNot supportedSupported
Hardware-accelerated markersSupported for OpenGL 4.0 or higherDisabledNot supportedNot supportedSupported

Graphics Smoothing

Graphics smoothing improves the appearance of plots by reducing jagged lines. By default, this feature is enabled if your system supports it. To turn off this feature for a particular figure, set the GraphicsSmoothing property of the figure to 'off'.

This table shows the difference when the feature is enabled or disabled.

When Supported and EnabledWhen Not Supported or Disabled

Axes graphic with smoothing. The plotted line appears smooth.

Axes graphic with no smoothing. The plotted line appears jagged.

(Zoomed-in view)

Zoomed-in view of axes graphic with smoothing. The pixels near the edge of the graphic gradually transition from the blue graphic color to the white background color.


(Zoomed-in view)

Zoomed-in view of axes graphic with no smoothing. The color of each pixel is either the blue graphic color or the white background color, with no gradual transition between the two.


Depth Peel Transparency

Depth peel transparency is a feature for correctly drawing semitransparent 3-D objects or plots that contain intersecting semitransparent objects. In the table, the left image shows the result of using transparency on a sphere when the depth peel transparency feature is supported. The right image shows the same sphere with unexpected shaded areas that occur when the feature is not supported.

When SupportedWhen Not Supported

Semitransparent surface plot of a sphere

Semitransparent surface plot of a sphere that has randomly shaded sections inside the sphere (visual artifacts)

Align Vertex Centers

Align vertex centers is a feature for sharp vertical and horizontal lines. If graphics smoothing is enabled, horizontal and vertical lines might be uneven in thickness or color. The align vertex centers feature eliminates the uneven appearance. By default, the align vertex centers feature is not enabled. However, if your system supports this feature, then you can turn it on for objects that have an AlignVertexCenters property by setting the property to 'on'.

This table shows the difference when the feature is enabled or disabled.

When Supported and EnabledWhen Not Supported or Disabled

Four vertical lines that are sharp

Four vertical lines that are uneven in thickness. Some of the lines are blurry.

Hardware-Accelerated Markers

Hardware-accelerated markers take advantage of your graphics hardware for improved performance and quality. This table shows the difference when the feature is supported or not supported.

When SupportedWhen Not Supported

Five-pointed star with mitered (pointed) vertices

Five-pointed star with notched vertices

Tips

  • Painters is an alternate rendering method for screen display and printing. For more information, see the Renderer property of the figure.

  • By default, MATLAB tries to use hardware-accelerated graphics if your graphics hardware supports it. However, in some cases, MATLAB automatically switches to a software implementation if it detects one of these situations:

    • You are using a graphics driver with known issues or graphics virtualization.

    • A previous MATLAB session crashed due to a graphics issue. If the previous session was using software OpenGL and crashed, then subsequent sessions use a more stable version of software OpenGL that has fewer capabilities.

    • Your system does not have the necessary graphics hardware.

Version History

Introduced in R2019a

expand all