addToolbarMapButton
Syntax
Description
addToolbarMapButton( adds all map buttons
to the axes toolbar tb)tb. The axes toolbar must be in a
GeographicAxes object.
addToolbarMapButton( creates a
basemap picker and adds it to the axes toolbar. Open the basemap picker by selecting
tb,"basemap")![]() Pick Basemap from the axes toolbar. The basemap picker appears near the
upper-right corner of the map.
Pick Basemap from the axes toolbar. The basemap picker appears near the
upper-right corner of the map.
addToolbarMapButton(
specifies basemap options using name-value arguments. For example, specify basemaps to
include in the basemap picker by using the tb,"basemap",Name=Value)BasemapNames name-value
argument.
Examples
Display the locations of European capitals on a map. When there is no current axes, the geoiconchart function plots the data by creating a new geographic axes.
[lat,lon] = readvars("european_capitals.txt");

figure
geoiconchart(lat,lon)
geolimits([37.3 54.6],[-8.9 31.2])
Create a custom axes toolbar. Add all map buttons to the toolbar.
tb = axtoolbar("default");
addToolbarMapButton(tb)
Remove all map buttons from the toolbar.
removeToolbarMapButton(tb)
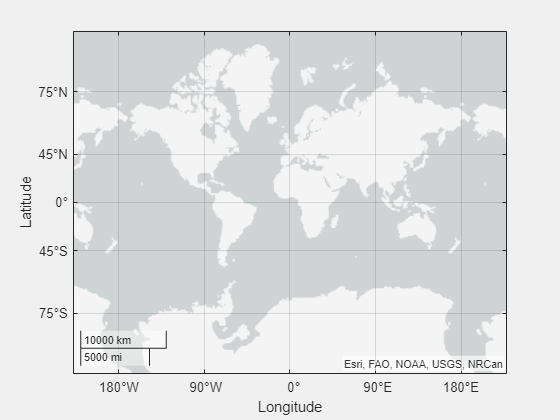
Display the locations of tsunami events on a map. When there is no current axes, the geoplot function plots the data by creating a new geographic axes. By default, geographic plots use the "streets-light" basemap.
GT = readgeotable("tsunamis.shp",CoordinateSystemType="geographic");

figure
geoplot(GT,"r+")
geolimits([-24.4 21],[95 169.4])
Preserve the toolbar, limits, and plotted data by using the hold function.
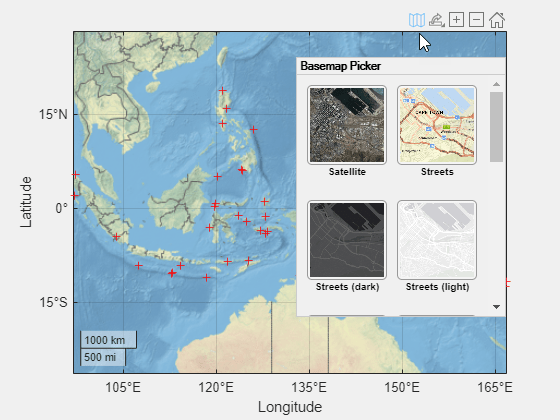
hold onCreate a custom toolbar by using the axtoolbar function. Add the basemap picker to the toolbar.
tb = axtoolbar("default");
addToolbarMapButton(tb,"basemap")
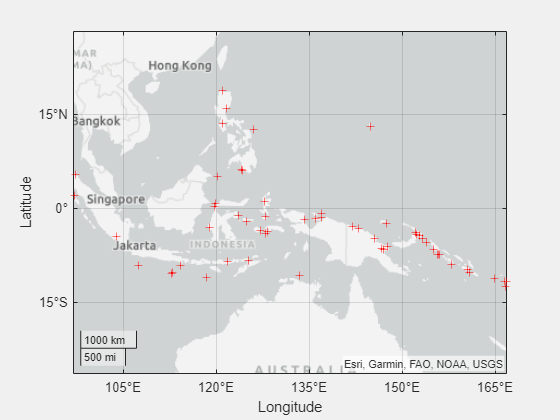
Open the toolbar and select a basemap.
Add the OpenStreetMap® basemap to the list of basemaps available for use with mapping functions. After you add the basemap, you do not need to add it again in future sessions. The basemap picker uses the display name you specify when you add the basemap.
name = "openstreetmap";
url = "https://a.tile.openstreetmap.org/${z}/${x}/${y}.png";
copyright = char(uint8(169));
displayName = "OpenStreetMap";
attribution = copyright + "OpenStreetMap contributors";
addCustomBasemap(name,url,Attribution=attribution,DisplayName=displayName)
Read a sample route from a GPX file into a table.
GT = readgeotable("sample_route.gpx",Layer="routes");
Display the route on a map. When there is no current axes, the geoplot function plots the data by creating a new geographic axes.
figure
geoplot(GT,LineWidth=2)
hold on
Add a basemap picker to the axes toolbar. Include the OpenStreetMap basemap and the high-zoom-level basemaps provided by Esri®.
tb = axtoolbar("default");
bmaps = ["openstreetmap","streets","streets-light", ...
    "streets-dark","topographic","satellite"];
addToolbarMapButton(tb,"basemap",BasemapNames=bmaps)
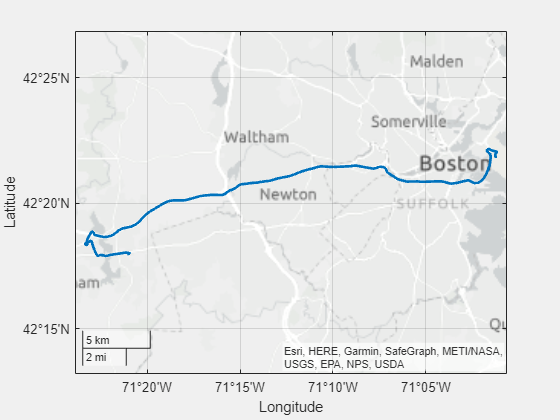
Open the basemap picker and select the OpenStreetMap basemap.
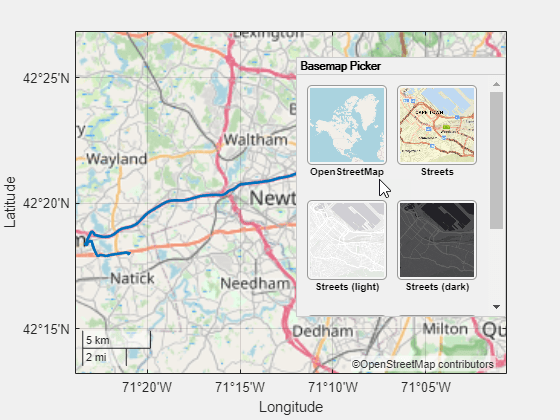
By default, the basemap picker uses the Level 1, North America tile as the icon for custom basemaps. Create a basemap picker with custom icons.
Add the OpenStreetMap basemap to the list of basemaps available for use with mapping functions. After you add the basemap, you do not need to add it again in future sessions.
name = "openstreetmap";
url = "https://a.tile.openstreetmap.org/${z}/${x}/${y}.png";
copyright = char(uint8(169));
displayName = "OpenStreetMap";
attribution = copyright + "OpenStreetMap contributors";
addCustomBasemap(name,url,Attribution=attribution,DisplayName=displayName)
Read a sample route from a GPX file into a table.
GT = readgeotable("sample_route.gpx",Layer="routes");
Display the route on a map. When there is no current axes, the geoplot function plots the data by creating a new geographic axes.
figure
geoplot(GT,LineWidth=2)
hold on
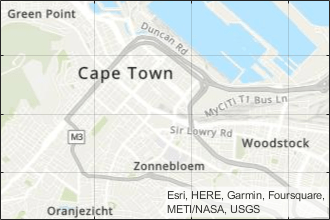
Specify the locations of the icons. For the custom basemap, use an icon that shows an area around Cape Town, South Africa. For the streets basemap, use the default icon.
osm_filename = "openstreetmap_256.png";
streets_filename = fullfile(matlabroot,"toolbox","shared","basemaps", ...
    "resources","icons","streets.png");
Create a basemap picker that includes the custom basemap, the "streets" basemap, and the custom icon.
tb = axtoolbar("default");
addToolbarMapButton(tb,"basemap",BasemapNames=["openstreetmap","streets"], ...
    BasemapIcons=[osm_filename,streets_filename])
![]()
Open the basemap picker and view the icons.
![]()
Input Arguments
Axes toolbar, specified as an AxesToolbar object or an array of
AxesToolbar objects. The axes toolbar must be in a
GeographicAxes object. Create the toolbar by using the axtoolbar
function.
You can add only one of each type of map button to the axes toolbar. Adding a new button replaces any existing icons of the same type.
Name-Value Arguments
Specify optional pairs of arguments as
Name1=Value1,...,NameN=ValueN, where Name is
the argument name and Value is the corresponding value.
Name-value arguments must appear after other arguments, but the order of the
pairs does not matter.
Example: addToolbarMapButton(tb,"basemap",BasemapNames=["streets","satellite"],NumColumns=1)
specifies a basemap picker with one column and the "streets" and
"satellite" basemaps.
Basemaps to include in the basemap picker, specified as a string array or a cell
array of character vectors. You can specify the basemaps shown in the table and
basemaps added using the addCustomBasemap function. Five basemaps in the table are
high-zoom-level maps hosted by Esri®. The other six basemaps are tiled data sets created using Natural Earth. By default, the basemap picker includes all available basemaps,
including custom basemaps, except "none".
|
|
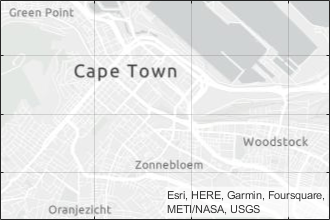
Map designed to provide geographic context while highlighting user data on a light background. Hosted by Esri. |
|
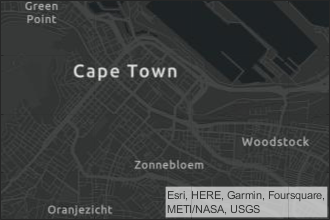
Map designed to provide geographic context while highlighting user data on a dark background. Hosted by Esri. |
|
|
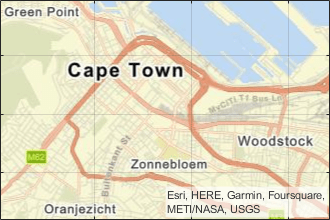
General-purpose road map that emphasizes accurate, legible styling of roads and transit networks. Hosted by Esri. |
|
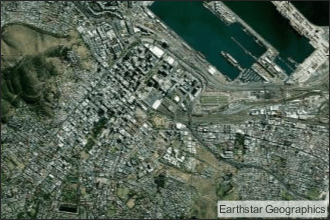
Full global basemap composed of high-resolution satellite imagery. Hosted by Esri. |
|
|
General-purpose map with styling to depict topographic features. Hosted by Esri. |
|
Map that combines satellite-derived land cover data, shaded relief, and ocean-bottom relief. The light, natural palette is suitable for thematic and reference maps. Created using Natural Earth. |
|
|
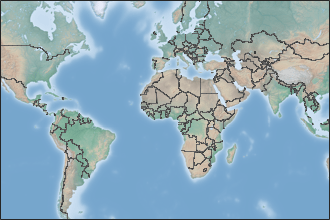
Shaded relief map blended with a land cover palette. Humid lowlands are green and arid lowlands are brown. Created using Natural Earth. |
|
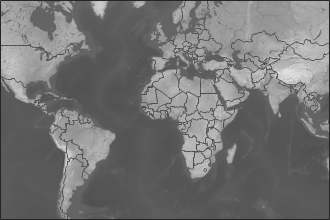
Terrain map in shades of gray. Shaded relief emphasizes both high mountains and micro-terrain found in lowlands. Created using Natural Earth. |
|
|
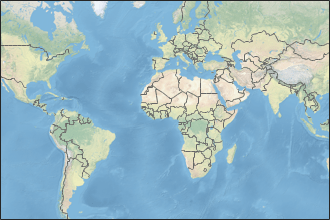
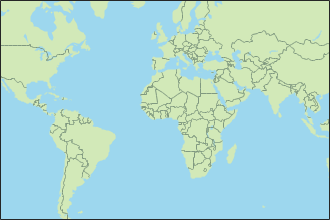
Two-tone, land-ocean map with light green land areas and light blue water areas. Created using Natural Earth. |
|
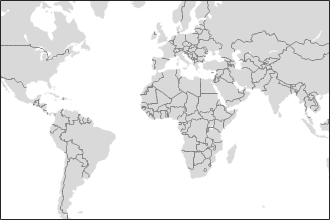
Two-tone, land-ocean map with gray land areas and white water areas. Created using Natural Earth. |
|
|
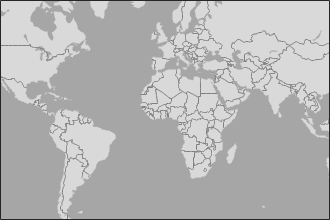
Two-tone, land-ocean map with light gray land areas and dark gray water areas. This basemap is installed with MATLAB®. Created using Natural Earth. | N/A |
Blank background that plots your data with a latitude-longitude grid, ticks, and labels. |
All basemaps except "darkwater" require Internet access. The
"darkwater" basemap is included with MATLAB.
If you do not have consistent access to the Internet, you can download the basemaps created using Natural Earth onto your local system by using the Add-On Explorer. The five high-zoom-level maps are not available for download. For more information about downloading basemaps and changing the default basemap on your local system, see Access Basemaps for Geographic Axes and Charts.
The basemaps hosted by Esri update periodically. As a result, you might see differences in your visualizations over time.
Alignment of boundaries and region labels are a presentation of the feature provided by the data vendors and do not imply endorsement by MathWorks®.
If you specify any combination of BasemapNames,
DisplayNames, and BasemapIcons, they must
all be the same size. The elements of BasemapNames correspond
with the elements of DisplayNames and
BasemapIcons.
Example: BasemapNames=["streets","satellite"]
Data Types: char | string
Basemap labels, specified as a string array or a cell array of character vectors. When a label is longer than the width of a column, MATLAB breaks the label into separate lines so that each line fits within the width of the column, and avoids breaking words when possible. Basemap labels display up to three lines. MATLAB truncates labels that are longer than three lines.
The default display name for each basemap is:
"satellite"— Satellite"streets"— Streets"streets-dark"— Streets (dark)"streets-light"— Streets (light)"topographic"— Topographic"darkwater"— Dark Water"bluegreen"— Blue Green"grayterrain"— Gray Terrain"colorterrain"— Color Terrain"landcover"— Land Cover"none"— noneCustom basemap — Display name specified by the
addCustomBasemapfunction. If you do not specify a display name when you add the custom basemap, then the basemap picker uses the basemap name.
Create a basemap picker with no display names by specifying
DisplayNames as "".
If you specify any combination of BasemapNames,
DisplayNames, and BasemapIcons, they must
all be the same size. The elements of DisplayNames correspond
with the elements of BasemapNames and
BasemapIcons.
Example: DisplayNames=["Road Map","Satellite
Imagery"]
Data Types: char | string
Icon file names, specified as a string array or a cell array of character vectors. Supported image formats include JPEG, PNG, GIF, and SVG.
Specify file names based on the locations of your files.
If a file is in your current folder or in a folder on the MATLAB path, then specify the name of the file only, such as
"myIcon.png".If a file is not in the current folder or in a folder on the MATLAB path, then specify the full or relative path name, such as
"C:\myfolder\myFile.png"or"dataDir\myFile.png".
The default basemap icons are in the folder
matlabroot/toolbox/shared/basemaps/resources/iconsaddCustomBasemap function, the default icon is the Level 1, North
America tile.
When an icon has a side length greater than 80 pixels, MATLAB scales the icon to fit.
Create a basemap picker with no icon images by specifying
BasemapIcons as "". In this case, the icons
display the basemap names instead of images.
If you specify any combination of BasemapNames,
DisplayNames, and BasemapIcons, they must
all be the same size. The elements of BasemapIcons correspond
with the elements of BasemapNames and
DisplayNames.
Example: BasemapIcons=["myIcon1.png","myIcon2.png"]
Data Types: char | string
Number of basemap picker columns, specified as a positive integer.
Example: NumColumns=3
Data Types: single | double
Limitations
When the
Scrollableproperty of the figure istrue, the basemap picker may not appear, or may appear in a different location than the upper-right corner.
Version History
Introduced in R2021bAdd a basemap picker to an axes toolbar in any type of figure. In previous releases, the
addToolbarMapButton function required the axes toolbar to be in a
figure created using the uifigure function.
See Also
Functions
MATLAB Command
You clicked a link that corresponds to this MATLAB command:
Run the command by entering it in the MATLAB Command Window. Web browsers do not support MATLAB commands.
Website auswählen
Wählen Sie eine Website aus, um übersetzte Inhalte (sofern verfügbar) sowie lokale Veranstaltungen und Angebote anzuzeigen. Auf der Grundlage Ihres Standorts empfehlen wir Ihnen die folgende Auswahl: .
Sie können auch eine Website aus der folgenden Liste auswählen:
So erhalten Sie die bestmögliche Leistung auf der Website
Wählen Sie für die bestmögliche Website-Leistung die Website für China (auf Chinesisch oder Englisch). Andere landesspezifische Websites von MathWorks sind für Besuche von Ihrem Standort aus nicht optimiert.
Amerika
- América Latina (Español)
- Canada (English)
- United States (English)
Europa
- Belgium (English)
- Denmark (English)
- Deutschland (Deutsch)
- España (Español)
- Finland (English)
- France (Français)
- Ireland (English)
- Italia (Italiano)
- Luxembourg (English)
- Netherlands (English)
- Norway (English)
- Österreich (Deutsch)
- Portugal (English)
- Sweden (English)
- Switzerland
- United Kingdom (English)
