spectrumplot
Plot disturbance spectrum of linear identified models
Syntax
spectrumplot(sys)
spectrumplot(sys,line_spec)
spectrumplot(sys1,line_spec1,...,sysN,line_specN)
spectrumplot(ax, ___)
spectrumplot(___,plot_options)
spectrumplot(sys,w)
h = spectrumplot(___)
Description
spectrumplot(
plots the disturbance
spectrum of the model, sys
)sys
. The software chooses the number of
points on the plot and the plot frequency range.
If sys
is a time-series model, its disturbance spectrum is the
same as the model output spectrum. You generally use this function with time-series
models.
spectrumplot(
uses sys
,line_spec
)line_spec
to specify the line type, marker symbol, and
color.
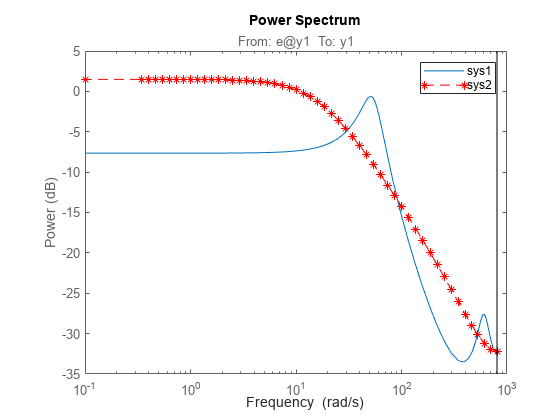
spectrumplot(sys1,line_spec1,...,sysN,line_specN)
plots the
disturbance spectrum for one or more models on the same axes.
You can mix sys
,line_spec
pairs with
sys
models as in
spectrumplot(sys1,sys2,line_spec2,sys3)
.
spectrumplot
automatically chooses colors and line styles in the
order specified by the ColorOrder
and
LineStyleOrder
properties of the current axes.
spectrumplot(
plots into
the axes with handle ax
, ___)ax
. All input arguments described for the
previous syntaxes also apply here.
spectrumplot(___,
uses plot_options
)plot_options
to specify options such as plot title, frequency
units, etc. All input arguments described for the previous syntaxes also apply
here.
spectrumplot(
uses sys
,w
)w
to specify the plot frequencies.
If
w
is specified as a 2-element cell array,{wmin, wmax}
, the plot spans the frequency range{wmin, wmax}
.If
w
is specified as vector, the spectrum is plotted for the specified frequencies.
Specify w
as radians/time_unit
, where
time_unit
must equal sys.TimeUnit
.
returns
the handle to the spectrum plot. You use the handle to customize the plot. All input
arguments described for the previous syntaxes also apply here.h
= spectrumplot(___)
Input Arguments
|
Identified linear model. |
|
Line style, marker, and color of both the line and marker, specified as a
character vector. For example, For more information, see Line Properties . |
|
Plot axes handle. Specify as a double-precision value. You can obtain the current axes handle by using the function, |
|
Plot customization options. Specify as a plot options object. You use the command, |
|
Frequency range. Specify in |
Output Arguments
|
Plot handle for spectrum plot, returned as a double-precision value. |
Examples
Version History
Introduced in R2012b
See Also
spectrum
| spectrumoptions
| getoptions
| setoptions
| showConfidence
| Axes Properties | Line Properties