What Are Moving Statistics?
You can measure statistics of streaming signals in MATLAB® and Simulink® along each independent data channel using the moving statistics System objects and blocks. Statistics such as average, RMS, standard deviation, variance, median, maximum, and minimum change as the data changes constantly with time. With every data sample that comes in, the System objects and blocks compute the statistics over the current sample and a specific window of past samples. This window "moves" as new data comes in.
| MATLAB System object™ | Simulink Block | Statistic Computed |
|---|---|---|
dsp.MedianFilter | Median Filter | Moving median |
dsp.MovingAverage | Moving Average | Moving average |
dsp.MovingMaximum | Moving Maximum | Moving maximum |
dsp.MovingMinimum | Moving Minimum | Moving minimum |
dsp.MovingRMS | Moving RMS | Moving RMS |
dsp.MovingStandardDeviation | Moving Standard Deviation | Moving standard deviation |
dsp.MovingVariance | Moving Variance | Moving variance |
powermeter | Power Meter | Power measurements of voltage signal |
These System objects and blocks compute the moving statistic using one or both of the sliding window method and exponential weighting method. For more details on these methods, see Sliding Window Method and Exponential Weighting Method.
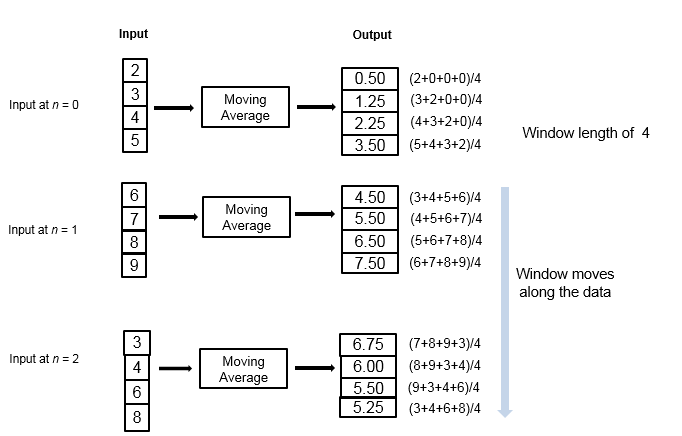
Consider an example of computing the moving average of a streaming input data using the sliding window method. The algorithm uses a window length of 4 and an overlap length of 3. At the first time step, the algorithm waits until it receives the hop size number of input samples. Hop size is defined as window length – overlap length. Remaining samples in the window are considered to be zero. After generating the first output, it generates the subsequent output samples for every hop size number of input samples. The moving statistic algorithms have a state and remember the previous data.
In the case of moving maximum, moving minimum, and median filter objects and blocks, you can not specify the overlap length. The algorithm assumes the overlap length to be window length – 1.
If the data is stationary, use the stationary statistics blocks to compute the statistics over the entire data in Simulink. Stationary blocks include Autocorrelation, Correlation, Maximum, Mean, Median, Minimum, RMS, Sort, Standard Deviation, and Variance.
These blocks do not maintain a state. When a new data sample comes in, the algorithm computes the statistic over the entire data and has no influence from the previous state of the block.
Consider an example of computing the stationary average of streaming input data using the Mean block in Simulink. The Mean block is configured to find the mean value over each column.
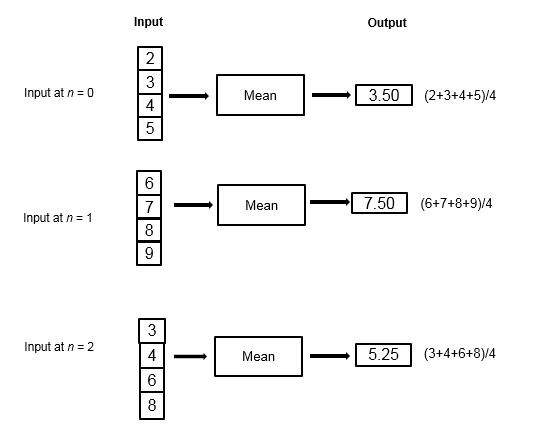
At each time step, the algorithm computes the average over the entire data that is available in the current time step and does not use data from the previous time step. The stationary statistics blocks are more suitable for data that is already available rather than for streaming data.