getFrequencyVector
Vector of frequencies at which estimation is done
Description
Examples
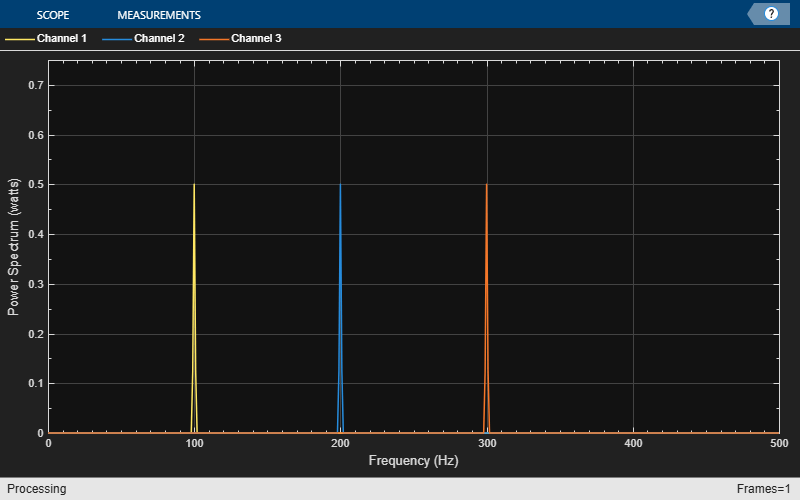
Compute the power spectrum of a multichannel sinusoidal signal using the dsp.SpectrumEstimator System object™. You can get the vector of frequencies at which the spectrum is estimated using the getFrequencyVector function. To compute the resolution bandwidth of the estimate (RBW), use the getRBW function.
Generate a three-channel sinusoid sampled at 1 kHz. Specify sinusoidal frequencies of 100, 200, and 300 Hz. The second and third channels have their phases offset from the first by  and
and  , respectively.
sineSignal = dsp.SineWave(SamplesPerFrame=1000,SampleRate=1000, ...
    Frequency=[100 200 300],PhaseOffset=[0 pi/2 pi/4]);
Estimate and plot the one-sided spectrum of the signal. Use the dsp.SpectrumEstimator object for the computation and the dsp.ArrayPlot for the plotting.
estimator = dsp.SpectrumEstimator(FrequencyRange="onesided");
plotter = dsp.ArrayPlot(PlotType="Line",YLimits=[0 0.75], ...
    YLabel="Power Spectrum (watts)",XLabel="Frequency (Hz)");
Step through to obtain the data streams and display the spectra of the three channels.
y = sineSignal();
pxx = estimator(y);
plotter(pxx)
Get the vector of frequencies at which the spectrum is estimated in Hz, using the getFrequencyVector function.
f = getFrequencyVector(estimator);
Compute the resolution bandwidth (RBW) of the estimate using the getRBW function.
getRBW(estimator)
ans =

    0.0015
The resolution bandwidth of the signal power spectrum is 0.0015 Hz. This frequency is the smallest frequency that can be resolved on the spectrum.
Input Arguments
Output Arguments
Version History
Introduced in R2013b