predict
(Not recommended) Predict responses using trained deep learning neural network
predict is not recommended. Use the minibatchpredict or the predict (dlnetwork) function instead. For
more information, see Version
History.
Syntax
Description
You can make predictions using a trained neural network for deep learning on
either a CPU or GPU. Using a GPU requires
a Parallel Computing Toolbox™ license and a supported GPU device. For information about supported devices, see
GPU Computing Requirements (Parallel Computing Toolbox). Specify the hardware requirements using the
ExecutionEnvironment name-value argument.
[
predicts responses for the Y1,...,YM] = predict(___)M outputs of a multi-output
network using any of the previous input arguments. The output
Yj corresponds to the network output
net.OutputNames(j). To return categorical outputs for the
classification output layers, set the ReturnCategorical option to 1 (true).
___ = predict(___,
predicts the responses with additional options specified by one or more
name-value arguments.Name=Value)
Tip
Use the
predictfunction to predict responses using a regression network or to classify data using a multi-output network. To classify data using a single-output classification network, use theclassifyfunction.When you make predictions with sequences of different lengths, the mini-batch size can impact the amount of padding added to the input data, which can result in different predicted values. Try using different values to see which works best with your network. To specify mini-batch size and padding options, use the
MiniBatchSizeandSequenceLengthoptions, respectively.For predicting responses using
dlnetworkobjects, seepredict.
Examples
Predict numeric responses using a trained convolutional neural network
Load a pretrained SqueezeNet neural network.
net = squeezenet;
Read and display an example image.
I = imread("peppers.png");
figure
imshow(I)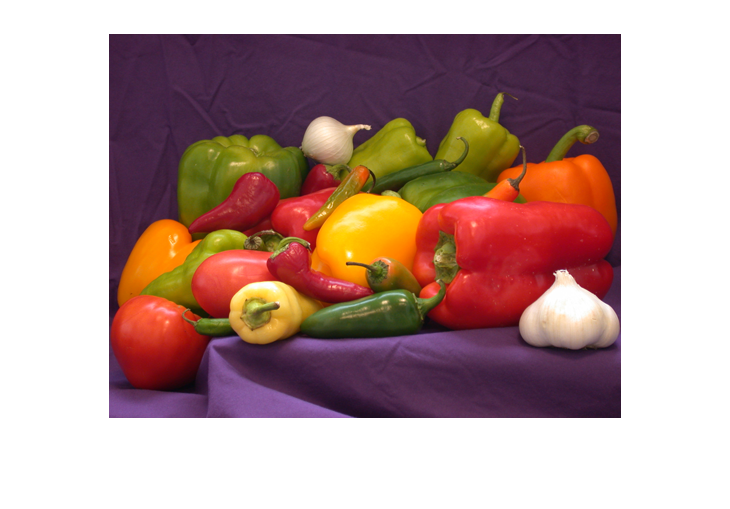
Resize the image to the network input size.
sz = net.Layers(1).InputSize;
I = imresize(I,sz(1:2));
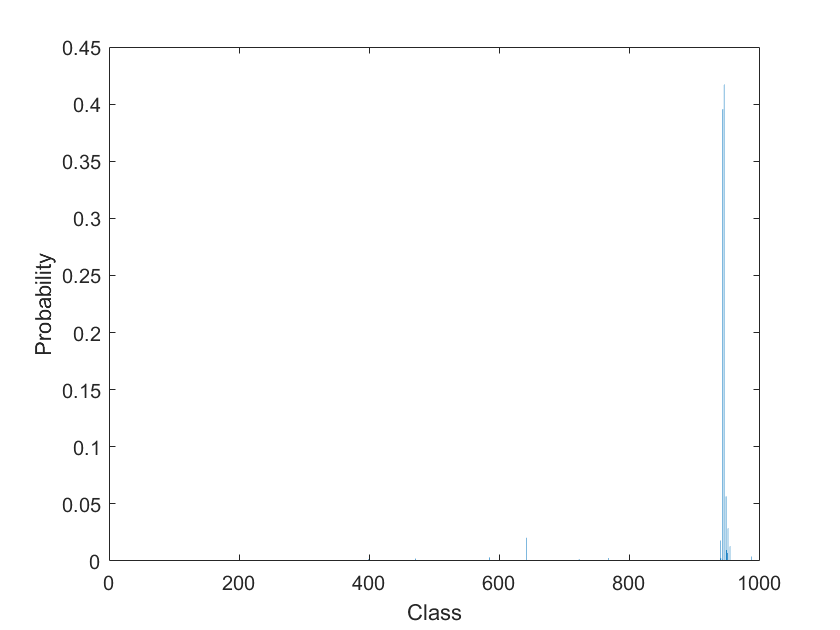
Make predictions using the predict function. Because
the network is a classification network, the output of the
predict function is the class probabilities. For
regression networks, the function outputs the predicted numeric
responses.
Y = predict(net,I);
Display the probabilities in a bar chart.
figure
bar(Y)
xlabel("Class")
ylabel("Probability")
Input Arguments
Trained network, specified as a SeriesNetwork or a DAGNetwork object. You can get a trained network by importing
a pretrained network (for example, by using the
googlenet function) or by training your own network
using trainNetwork.
For information on predicting responses using dlnetwork
objects, see predict.
Image data, specified as one of the following.
| Data Type | Description | Example Usage | |
|---|---|---|---|
| Datastore | ImageDatastore | Datastore of images saved on disk | Make predictions with images saved on disk, where the images are the same size. When the images are different sizes, use an
|
augmentedImageDatastore | Datastore that applies random affine geometric transformations, including resizing, rotation, reflection, shear, and translation | Make predictions with images saved on disk, where the images are different sizes. | |
TransformedDatastore | Datastore that transforms batches of data read from an underlying datastore using a custom transformation function |
| |
CombinedDatastore | Datastore that reads from two or more underlying datastores |
| |
| Custom mini-batch datastore | Custom datastore that returns mini-batches of data | Make predictions using data in a format that other datastores do not support. For details, see Develop Custom Mini-Batch Datastore. | |
| Numeric array | Images specified as a numeric array | Make predictions using data that fits in memory and does not require additional processing like resizing. | |
| Table | Images specified as a table | Make predictions using data stored in a table. | |
When you use a datastore with networks with multiple inputs, the datastore must be a
TransformedDatastore or
CombinedDatastore
object.
Tip
For sequences of images, for example, video data, use the sequences
input argument.
Datastore
Datastores read mini-batches of images and responses. Use datastores when you have data that does not fit in memory or when you want to resize the input data.
These datastores are directly compatible with predict for image data.:
Custom mini-batch datastore. For details, see Develop Custom Mini-Batch Datastore.
Tip
Use augmentedImageDatastore for efficient preprocessing of images for deep
learning, including image resizing. Do not use the ReadFcn option of
ImageDatastore objects.
ImageDatastore allows batch reading of JPG or PNG image files
using prefetching. If you set the ReadFcn option to a custom
function, then ImageDatastore does not prefetch and is usually
significantly slower.
You can use other built-in datastores for making predictions by using the transform and
combine
functions. These functions can convert the data read from datastores to the format required
by classify.
The required format of the datastore output depends on the network architecture.
| Network Architecture | Datastore Output | Example Output |
|---|---|---|
| Single input | Table or cell array, where the first column specifies the predictors. Table elements must be scalars, row vectors, or 1-by-1 cell arrays containing a numeric array. Custom datastores must output tables. |
data = read(ds) data =
4×1 table
Predictors
__________________
{224×224×3 double}
{224×224×3 double}
{224×224×3 double}
{224×224×3 double}
|
data = read(ds) data =
4×1 cell array
{224×224×3 double}
{224×224×3 double}
{224×224×3 double}
{224×224×3 double} | ||
| Multiple input | Cell array with at least The
first The order of inputs is given by the
|
data = read(ds) data =
4×2 cell array
{224×224×3 double} {128×128×3 double}
{224×224×3 double} {128×128×3 double}
{224×224×3 double} {128×128×3 double}
{224×224×3 double} {128×128×3 double} |
The format of the predictors depends on the type of data.
| Data | Format |
|---|---|
| 2-D images | h-by-w-by-c numeric array, where h, w, and c are the height, width, and number of channels of the images, respectively |
| 3-D images | h-by-w-by-d-by-c numeric array, where h, w, d, and c are the height, width, depth, and number of channels of the images, respectively |
For more information, see Datastores for Deep Learning.
Numeric Array
For data that fits in memory and does not require additional processing like augmentation, you can specify a data set of images as a numeric array.
The size and shape of the numeric array depends on the type of image data.
| Data | Format |
|---|---|
| 2-D images | h-by-w-by-c-by-N numeric array, where h, w, and c are the height, width, and number of channels of the images, respectively, and N is the number of images |
| 3-D images | h-by-w-by-d-by-c-by-N numeric array, where h, w, d, and c are the height, width, depth, and number of channels of the images, respectively, and N is the number of images |
Table
As an alternative to datastores or numeric arrays, you can also specify images in a table.
When you specify images in a table, each row in the table corresponds to an observation.
For image input, the predictors must be in the first column of the table, specified as one of the following:
Absolute or relative file path to an image, specified as a character vector
1-by-1 cell array containing a h-by-w-by-c numeric array representing a 2-D image, where h, w, and c correspond to the height, width, and number of channels of the image, respectively
Tip
This argument supports complex-valued predictors. To input complex-valued data into a
SeriesNetwork or DAGNetwork object, the
SplitComplexInputs option of the input layer must be
1 (true).
Sequence or time series data, specified as one of the following.
| Data Type | Description | Example Usage | |
|---|---|---|---|
| Datastore | TransformedDatastore | Datastore that transforms batches of data read from an underlying datastore using a custom transformation function |
|
CombinedDatastore | Datastore that reads from two or more underlying datastores |
| |
| Custom mini-batch datastore | Custom datastore that returns mini-batches of data | Make predictions using data in a format that other datastores do not support. For details, see Develop Custom Mini-Batch Datastore. | |
| Numeric or cell array | A single sequence specified as a numeric array or a data set of sequences specified as cell array of numeric arrays | Make predictions using data that fits in memory and does not require additional processing like custom transformations. | |
Datastore
Datastores read mini-batches of sequences and responses. Use datastores when you have data that does not fit in memory or when you want to apply transformations to the data.
These datastores are directly compatible with predict for
sequence data:
Custom mini-batch datastore. For details, see Develop Custom Mini-Batch Datastore.
You can use other built-in datastores for making predictions by using
the transform and combine functions. These functions can convert the data read from
datastores to the table or cell array format required by
predict. For example, you can transform and combine
data read from in-memory arrays and CSV files using an
ArrayDatastore and an TabularTextDatastore
object, respectively.
The datastore must return data in a table or cell array. Custom mini-batch datastores must output tables.
| Datastore Output | Example Output |
|---|---|
| Table |
data = read(ds) data =
4×2 table
Predictors
__________________
{12×50 double}
{12×50 double}
{12×50 double}
{12×50 double} |
| Cell array |
data = read(ds) data =
4×2 cell array
{12×50 double}
{12×50 double}
{12×50 double}
{12×50 double} |
The format of the predictors depends on the type of data.
| Data | Format of Predictors |
|---|---|
| Vector sequence | c-by-s matrix, where c is the number of features of the sequence and s is the sequence length |
| 1-D image sequence | h-by-c-by-s array, where h and c correspond to the height and number of channels of the image, respectively, and s is the sequence length. Each sequence in the mini-batch must have the same sequence length. |
| 2-D image sequence | h-by-w-by-c-by-s array, where h, w, and c correspond to the height, width, and number of channels of the image, respectively, and s is the sequence length. Each sequence in the mini-batch must have the same sequence length. |
| 3-D image sequence | h-by-w-by-d-by-c-by-s array, where h, w, d, and c correspond to the height, width, depth, and number of channels of the image, respectively, and s is the sequence length. Each sequence in the mini-batch must have the same sequence length. |
For predictors returned in tables, the elements must contain a numeric scalar, a numeric row vector, or a 1-by-1 cell array containing a numeric array.
For more information, see Datastores for Deep Learning.
Numeric or Cell Array
For data that fits in memory and does not require additional processing like custom transformations, you can specify a single sequence as a numeric array or a data set of sequences as a cell array of numeric arrays.
For cell array input, the cell array must be an N-by-1 cell array of numeric arrays, where N is the number of observations. The size and shape of the numeric array representing a sequence depends on the type of sequence data.
| Input | Description |
|---|---|
| Vector sequences | c-by-s matrices, where c is the number of features of the sequences and s is the sequence length |
| 1-D image sequences | h-by-c-by-s arrays, where h and c correspond to the height and number of channels of the images, respectively, and s is the sequence length |
| 2-D image sequences | h-by-w-by-c-by-s arrays, where h, w, and c correspond to the height, width, and number of channels of the images, respectively, and s is the sequence length |
| 3-D image sequences | h-by-w-by-d-by-c-by-s, where h, w, d, and c correspond to the height, width, depth, and number of channels of the 3-D images, respectively, and s is the sequence length |
Tip
This argument supports complex-valued predictors. To input complex-valued data
into a SeriesNetwork or DAGNetwork object, the
SplitComplexInputs option of the input layer must be
1 (true).
Feature data, specified as one of the following.
| Data Type | Description | Example Usage | |
|---|---|---|---|
| Datastore | TransformedDatastore | Datastore that transforms batches of data read from an underlying datastore using a custom transformation function |
|
CombinedDatastore | Datastore that reads from two or more underlying datastores |
| |
| Custom mini-batch datastore | Custom datastore that returns mini-batches of data | Make predictions using data in a format that other datastores do not support. For details, see Develop Custom Mini-Batch Datastore. | |
| Table | Feature data specified as a table | Make predictions using data stored in a table. | |
| Numeric array | Feature data specified as numeric array | Make predictions using data that fits in memory and does not require additional processing like custom transformations. | |
Datastore
Datastores read mini-batches of feature data and responses. Use datastores when you have data that does not fit in memory or when you want to apply transformations to the data.
These datastores are directly compatible with predict for
feature data:
Custom mini-batch datastore. For details, see Develop Custom Mini-Batch Datastore.
You can use other built-in datastores for making predictions by using the transform and
combine
functions. These functions can convert the data read from datastores to the table or cell
array format required by predict. For more information, see Datastores for Deep Learning.
For networks with multiple inputs, the datastore must be a TransformedDatastore or
CombinedDatastore
object.
The datastore must return data in a table or a cell array. Custom mini-batch datastores must output tables. The format of the datastore output depends on the network architecture.
| Network Architecture | Datastore Output | Example Output |
|---|---|---|
| Single input layer | Table or cell array with at least one column, where the first column specifies the predictors. Table elements must be scalars, row vectors, or 1-by-1 cell arrays containing a numeric array. Custom mini-batch datastores must output tables. | Table for network with one input: data = read(ds) data =
4×2 table
Predictors
__________________
{24×1 double}
{24×1 double}
{24×1 double}
{24×1 double}
|
Cell array for network with one input:
data = read(ds) data =
4×1 cell array
{24×1 double}
{24×1 double}
{24×1 double}
{24×1 double} | ||
| Multiple input layers | Cell array with at least The
first The order of inputs is given by the
| Cell array for network with two inputs: data = read(ds) data =
4×3 cell array
{24×1 double} {28×1 double}
{24×1 double} {28×1 double}
{24×1 double} {28×1 double}
{24×1 double} {28×1 double} |
The predictors must be c-by-1 column vectors, where c is the number of features.
For more information, see Datastores for Deep Learning.
Table
For feature data that fits in memory and does not require additional processing like custom transformations, you can specify feature data and responses as a table.
Each row in the table corresponds to an observation. The arrangement of predictors in the table columns depends on the type of task.
| Task | Predictors |
|---|---|
| Feature classification | Features specified in one or more columns as scalars. |
Numeric Array
For feature data that fits in memory and does not require additional processing like custom transformations, you can specify feature data as a numeric array.
The numeric array must be an
N-by-numFeatures numeric array, where
N is the number of observations and numFeatures is
the number of features of the input data.
Tip
This argument supports complex-valued predictors. To input complex-valued data into a
SeriesNetwork or DAGNetwork object, the
SplitComplexInputs option of the input layer must be
1 (true).
Numeric or cell arrays for networks with multiple inputs.
For image, sequence, and feature predictor input, the format of the predictors must
match the formats described in the images,
sequences, or features argument
descriptions, respectively.
For an example showing how to train a network with multiple inputs, see Train Network on Image and Feature Data.
To input complex-valued data into a DAGNetwork or
SeriesNetwork object, the SplitComplexInputs
option of the input layer must be 1 (true).
Data Types: single | double | int8 | int16 | int32 | int64 | uint8 | uint16 | uint32 | uint64 | cell
Complex Number Support: Yes
Mixed data, specified as one of the following.
| Data Type | Description | Example Usage |
|---|---|---|
TransformedDatastore | Datastore that transforms batches of data read from an underlying datastore using a custom transformation function |
|
CombinedDatastore | Datastore that reads from two or more underlying datastores |
|
| Custom mini-batch datastore | Custom datastore that returns mini-batches of data | Make predictions using data in a format that other datastores do not support. For details, see Develop Custom Mini-Batch Datastore. |
You can use other built-in datastores for making predictions by using the transform and combine functions. These functions can convert the data read from datastores to the table or cell array format required by predict. For more information, see Datastores for Deep Learning.
The datastore must return data in a table or a cell array. Custom mini-batch datastores must output tables. The format of the datastore output depends on the network architecture.
| Datastore Output | Example Output |
|---|---|
Cell array with The
order of inputs is given by the |
data = read(ds) data =
4×3 cell array
{24×1 double} {28×1 double}
{24×1 double} {28×1 double}
{24×1 double} {28×1 double}
{24×1 double} {28×1 double} |
For image, sequence, and feature predictor input, the format of the predictors must match
the formats described in the images, sequences, or
features argument descriptions, respectively.
For an example showing how to train a network with multiple inputs, see Train Network on Image and Feature Data.
Tip
To convert a numeric array to a datastore, use arrayDatastore.
Name-Value Arguments
Specify optional pairs of arguments as
Name1=Value1,...,NameN=ValueN, where Name is
the argument name and Value is the corresponding value.
Name-value arguments must appear after other arguments, but the order of the
pairs does not matter.
Before R2021a, use commas to separate each name and value, and enclose
Name in quotes.
Example: MiniBatchSize=256 specifies the mini-batch size as
256.
Size of mini-batches to use for prediction, specified as a positive integer. Larger mini-batch sizes require more memory, but can lead to faster predictions.
When you make predictions with sequences of different lengths,
the mini-batch size can impact the amount of padding added to the input data, which can result
in different predicted values. Try using different values to see which works best with your
network. To specify mini-batch size and padding options, use the MiniBatchSize and SequenceLength
options, respectively.
Data Types: single | double | int8 | int16 | int32 | int64 | uint8 | uint16 | uint32 | uint64
Performance optimization, specified as one of the following:
"auto"— Automatically apply a number of optimizations suitable for the input network and hardware resources."mex"— Compile and execute a MEX function. This option is available only when you use a GPU. Using a GPU requires a Parallel Computing Toolbox license and a supported GPU device. For information about supported devices, see GPU Computing Requirements (Parallel Computing Toolbox). If Parallel Computing Toolbox or a suitable GPU is not available, then the software returns an error."none"— Disable all acceleration.
If Acceleration is "auto", then MATLAB® applies a number of compatible optimizations and does not generate a MEX
function.
The "auto" and "mex" options can offer performance
benefits at the expense of an increased initial run time. Subsequent calls with
compatible parameters are faster. Use performance optimization when you plan to call the
function multiple times using new input data.
The "mex" option generates and executes a MEX function based on the network
and parameters used in the function call. You can have several MEX functions associated
with a single network at one time. Clearing the network variable also clears any MEX
functions associated with that network.
The "mex" option supports networks that contain the layers listed
on the Supported Layers (GPU Coder) page, except for
sequenceInputLayer objects.
The "mex" option is available when you use a single GPU.
To use the "mex" option, you must have a C/C++ compiler installed
and the GPU Coder™ Interface for Deep Learning support package. Install the support package using the Add-On Explorer in
MATLAB. For setup instructions, see Set Up Compiler (GPU Coder). GPU Coder is not required.
For quantized networks, the "mex" option requires a CUDA® enabled NVIDIA® GPU with compute capability 6.1, 6.3, or higher.
MATLAB
Compiler™ does not support deploying networks when you use the
"mex" option.
Hardware resource, specified as one of the following:
"auto"— Use a GPU if one is available; otherwise, use the CPU."gpu"— Use the GPU. Using a GPU requires a Parallel Computing Toolbox license and a supported GPU device. For information about supported devices, see GPU Computing Requirements (Parallel Computing Toolbox). If Parallel Computing Toolbox or a suitable GPU is not available, then the software returns an error."cpu"— Use the CPU."multi-gpu"— Use multiple GPUs on one machine, using a local parallel pool based on your default cluster profile. If there is no current parallel pool, the software starts a parallel pool with pool size equal to the number of available GPUs."parallel"— Use a local or remote parallel pool based on your default cluster profile. If there is no current parallel pool, the software starts one using the default cluster profile. If the pool has access to GPUs, then only workers with a unique GPU perform computation. If the pool does not have GPUs, then computation takes place on all available CPU workers instead.
For more information on when to use the different execution environments, see Scale Up Deep Learning in Parallel, on GPUs, and in the Cloud.
The "gpu", "multi-gpu", and
"parallel" options require Parallel Computing Toolbox. To use a GPU for deep
learning, you must also have a supported GPU device. For information on supported devices, see
GPU Computing Requirements (Parallel Computing Toolbox). If you choose one of these options and Parallel Computing Toolbox or a suitable GPU is not available, then the software returns an
error.
To make predictions in parallel with networks with recurrent layers (by setting
ExecutionEnvironment to either "multi-gpu"
or "parallel"), the SequenceLength option must
be "shortest" or "longest".
Networks with custom layers that contain State parameters do not
support making predictions in parallel.
Option to return categorical labels, specified as 0
(false) or 1 (true).
If ReturnCategorical is 1 (true),
then the function returns categorical labels for classification output layers.
Otherwise, the function returns the prediction scores for classification output
layers.
Option to pad, truncate, or split sequences, specified as one of these values:
"longest"— Pad sequences in each mini-batch to have the same length as the longest sequence. This option does not discard any data, though padding can introduce noise to the neural network."shortest"— Truncate sequences in each mini-batch to have the same length as the shortest sequence. This option ensures that no padding is added, at the cost of discarding data.Positive integer — For each mini-batch, pad the sequences to the length of the longest sequence in the mini-batch, and then split the sequences into smaller sequences of the specified length. If splitting occurs, then the software creates extra mini-batches. If the specified sequence length does not evenly divide the sequence lengths of the data, then the mini-batches containing the ends those sequences have length shorter than the specified sequence length. Use this option if the full sequences do not fit in memory. Alternatively, try reducing the number of sequences per mini-batch by setting the
MiniBatchSizeoption to a lower value.
To learn more about the effect of padding and truncating sequences, see Sequence Padding and Truncation.
Data Types: single | double | int8 | int16 | int32 | int64 | uint8 | uint16 | uint32 | uint64 | char | string
Direction of padding or truncation, specified as one of the following:
"right"— Pad or truncate sequences on the right. The sequences start at the same time step and the software truncates or adds padding to the end of the sequences."left"— Pad or truncate sequences on the left. The software truncates or adds padding to the start of the sequences so that the sequences end at the same time step.
Because recurrent layers process sequence data one time step at a time, when the recurrent layer OutputMode property is "last", any padding in the final time steps can negatively influence the layer output. To pad or truncate sequence data on the left, set the SequencePaddingDirection option to "left".
For sequence-to-sequence neural networks (when the OutputMode property is "sequence" for each recurrent layer), any padding in the first time steps can negatively influence the predictions for the earlier time steps. To pad or truncate sequence data on the right, set the SequencePaddingDirection option to "right".
To learn more about the effect of padding and truncating sequences, see Sequence Padding and Truncation.
Value by which to pad input sequences, specified as a scalar.
Do not pad sequences with NaN, because doing so can propagate errors throughout the neural network.
Data Types: single | double | int8 | int16 | int32 | int64 | uint8 | uint16 | uint32 | uint64
Output Arguments
Predicted responses, returned as a numeric array, a categorical array, or
a cell array. The format of Y depends on the type of
problem.
The following table describes the format for regression problems.
| Task | Format |
|---|---|
| 2-D image regression |
|
| 3-D image regression |
|
| Sequence-to-one regression | N-by-R matrix, where N is the number of sequences and R is the number of responses |
| Sequence-to-sequence regression | N-by-1 cell array of numeric
sequences, where N is the number of
sequences. The sequences are matrices with
R rows, where
R is the number of responses.
Each sequence has the same number of time steps as the
corresponding input sequence after the
For
sequence-to-sequence regression tasks with one
observation, |
| Feature regression | N-by-R matrix, where N is the number of observations and R is the number of responses |
For sequence-to-sequence regression problems with one observation,
sequences can be a matrix. In this case,
Y is a matrix of responses.
If ReturnCategorical is 0 (false)
and the output layer of the network is a classification layer, then
Y is the predicted classification scores. This
table describes the format of the scores for classification
tasks.
| Task | Format |
|---|---|
| Image classification | N-by-K matrix, where N is the number of observations and K is the number of classes |
| Sequence-to-label classification | |
| Feature classification | |
| Sequence-to-sequence classification | N-by-1 cell array of matrices, where N is the
number of observations. The sequences are matrices with K
rows, where K is the number of classes. Each sequence has
the same number of time steps as the corresponding input sequence after the
|
If ReturnCategorical is 1 (true),
and the output layer of the network is a classification layer, then
Y is a categorical vector or a cell array of
categorical vectors. This table describes the format of the labels for
classification tasks.
| Task | Format |
|---|---|
| Image or feature classification | N-by-1 categorical vector of labels, where N is the number of observations |
| Sequence-to-label classification | |
| Sequence-to-sequence classification | N-by-1 cell array of categorical sequences of labels, where
N is the number of
observations. Each sequence has the same number of
time steps as the corresponding input sequence
after the For
sequence-to-sequence classification tasks with one
observation, |
Predicted scores or responses of networks with multiple outputs, returned as numeric arrays, categorical arrays, or cell arrays.
Each output Yj corresponds to the network output
net.OutputNames(j) and has format as described in the
Y output argument.
Algorithms
When you train a neural network using the trainnet or trainNetwork functions, or when you use prediction or validation functions with DAGNetwork and SeriesNetwork objects, the software performs these computations using single-precision, floating-point arithmetic. Functions for prediction and validation include predict, classify, and activations. The software uses single-precision arithmetic when you train neural networks using both CPUs and GPUs.
To provide the best performance, deep learning using a GPU in MATLAB is not guaranteed to be deterministic. Depending on your network architecture, under some conditions you might get different results when using a GPU to train two identical networks or make two predictions using the same network and data.
Alternatives
For networks with a single classification layer only, you can compute the predicted
classes and the predicted scores from a trained network using the classify
function.
To compute the activations from a network layer, use the activations
function.
For recurrent networks such as LSTM networks, you can make predictions and update the
network state using classifyAndUpdateState and predictAndUpdateState.
References
[1] Kudo, Mineichi, Jun Toyama, and Masaru Shimbo. “Multidimensional Curve Classification Using Passing-through Regions.” Pattern Recognition Letters 20, no. 11–13 (November 1999): 1103–11. https://doi.org/10.1016/S0167-8655(99)00077-X.
[2] UCI Machine Learning Repository: Japanese Vowels Dataset. https://archive.ics.uci.edu/ml/datasets/Japanese+Vowels.
Extended Capabilities
Usage notes and limitations:
C++ code generation supports the following syntaxes:
Y = predict(net,images), whereimagesis a numeric arrayY = predict(net,sequences), wheresequencesis a cell arrayY = predict(net,features), wherefeaturesis a numeric array[Y1,...,YM] = predict(__)using any of the previous syntaxes__ = predict(__,Name=Value)using any of the previous syntaxes
For numeric inputs, the input must not have a variable size. The size must be fixed at code generation time.
For vector sequence inputs, the number of features must be a constant during code generation. The sequence length can be variable sized.
For image sequence inputs, the height, width, and the number of channels must be a constant during code generation.
Only the
MiniBatchSize,ReturnCategorical,SequenceLength,SequencePaddingDirection, andSequencePaddingValuename-value pair arguments are supported for code generation. All name-value pairs must be compile-time constants.Only the
"longest"and"shortest"options of theSequenceLengthname-value pair is supported for code generation.If
ReturnCategoricalis1(true) and you use a GCC C/C++ compiler version 8.2 or above, you might get a-Wstringop-overflowwarning.Code generation for Intel® MKL-DNN target does not support the combination of
SequenceLength="longest",SequencePaddingDirection="left", andSequencePaddingValue=0name-value arguments.
For more information about generating code for deep learning neural networks, see Workflow for Deep Learning Code Generation with MATLAB Coder (MATLAB Coder).
Usage notes and limitations:
GPU code generation supports the following syntaxes:
Y = predict(net,images), whereimagesis a numeric arrayY = predict(net,sequences), wheresequencesis a cell array or numeric arrayY = predict(net,features), wherefeaturesis a numeric array[Y1,...,YM] = predict(__)using any of the previous syntaxes__ = predict(__,Name=Value)using any of the previous syntaxes
For numeric inputs, the input must not have variable size. The size must be fixed at code generation time.
GPU code generation does not support
gpuArrayinputs to thepredictfunction.The cuDNN library supports vector and 2-D image sequences. The TensorRT library support only vector input sequences. The ARM®
Compute Libraryfor GPU does not support recurrent networks.For vector sequence inputs, the number of features must be a constant during code generation. The sequence length can be variable sized.
For image sequence inputs, the height, width, and the number of channels must be a constant during code generation.
Only the
MiniBatchSize,ReturnCategorical,SequenceLength,SequencePaddingDirection, andSequencePaddingValuename-value pair arguments are supported for code generation. All name-value pairs must be compile-time constants.Only the
"longest"and"shortest"option of theSequenceLengthname-value pair is supported for code generation.GPU code generation for the
predictfunction supports inputs that are defined as half-precision floating point data types. For more information, seehalf(GPU Coder).If
ReturnCategoricalis set to1(true) and you use a GCC C/C++ compiler version 8.2 or above, you might get a-Wstringop-overflowwarning.
To run computations in parallel, set the ExecutionEnvironment
option to "multi-gpu" or "parallel".
For details, see Scale Up Deep Learning in Parallel, on GPUs, and in the Cloud.
The
ExecutionEnvironmentoption must be"auto"or"gpu"when the input data is:A
gpuArrayA cell array containing
gpuArrayobjectsA table containing
gpuArrayobjectsA datastore that outputs cell arrays containing
gpuArrayobjectsA datastore that outputs tables containing
gpuArrayobjects
For more information, see Run MATLAB Functions on a GPU (Parallel Computing Toolbox).
Version History
Introduced in R2016aStarting in R2024a, DAGNetwork and SeriesNetwork
objects are not recommended, use dlnetwork objects instead. This
recommendation means that the predict function is also not
recommended. Use the minibatchpredict function or the predict (dlnetwork) function
instead.
There are no plans to remove support for DAGNetwork and
SeriesNetwork objects. However, dlnetwork
objects have these advantages and are recommended instead:
dlnetworkobjects are a unified data type that supports network building, prediction, built-in training, visualization, compression, verification, and custom training loops.dlnetworkobjects support a wider range of network architectures that you can create or import from external platforms.The
trainnetfunction supportsdlnetworkobjects, which enables you to easily specify loss functions. You can select from built-in loss functions or specify a custom loss function.Training and prediction with
dlnetworkobjects is typically faster thanLayerGraphandtrainNetworkworkflows.
To convert a trained DAGNetwork or SeriesNetwork
object to a dlnetwork object, use the dag2dlnetwork function.
This table shows a typical usage of the predict function and
how to update your code to use dlnetwork objects
instead.
| Not Recommended | Recommended |
|---|---|
Y = predict(net,X); |
Y = minibatchpredict(net,X); |
Starting in R2022b, when you make predictions with sequence data using the
predict, classify,
predictAndUpdateState, classifyAndUpdateState,
and activations functions and the SequenceLength
option is an integer, the software pads sequences to the length of the longest sequence in
each mini-batch and then splits the sequences into mini-batches with the specified sequence
length. If SequenceLength does not evenly divide the sequence length of
the mini-batch, then the last split mini-batch has a length shorter than
SequenceLength. This behavior prevents time steps that contain only
padding values from influencing predictions.
In previous releases, the software pads mini-batches of sequences to have a length matching the nearest multiple of SequenceLength that is greater than or equal to the mini-batch length and then splits the data. To reproduce this behavior, manually pad the input data such that the mini-batches have the length of the appropriate multiple of SequenceLength. For sequence-to-sequence workflows, you may also need to manually remove time steps of the output that correspond to padding values.
See Also
dlnetwork | predict | forward | minibatchpredict | scores2label | classifyAndUpdateState
Topics
MATLAB Command
You clicked a link that corresponds to this MATLAB command:
Run the command by entering it in the MATLAB Command Window. Web browsers do not support MATLAB commands.
Website auswählen
Wählen Sie eine Website aus, um übersetzte Inhalte (sofern verfügbar) sowie lokale Veranstaltungen und Angebote anzuzeigen. Auf der Grundlage Ihres Standorts empfehlen wir Ihnen die folgende Auswahl: .
Sie können auch eine Website aus der folgenden Liste auswählen:
So erhalten Sie die bestmögliche Leistung auf der Website
Wählen Sie für die bestmögliche Website-Leistung die Website für China (auf Chinesisch oder Englisch). Andere landesspezifische Websites von MathWorks sind für Besuche von Ihrem Standort aus nicht optimiert.
Amerika
- América Latina (Español)
- Canada (English)
- United States (English)
Europa
- Belgium (English)
- Denmark (English)
- Deutschland (Deutsch)
- España (Español)
- Finland (English)
- France (Français)
- Ireland (English)
- Italia (Italiano)
- Luxembourg (English)
- Netherlands (English)
- Norway (English)
- Österreich (Deutsch)
- Portugal (English)
- Sweden (English)
- Switzerland
- United Kingdom (English)