plotregression
(Zu entfernen) Plotten von linearer Regression
plotregression wird in einer zukünftigen Version entfernt. Weitere Informationen finden Sie unter Transition Legacy Neural Network Code to dlnetwork Workflows.
Ratschläge zur Aktualisierung Ihres Codes finden Sie unter Versionsverlauf.
Beschreibung
Beispiele
Dieses Beispiel zeigt, wie man die lineare Regression eines Feedforward-Netzes plottet.
[x,t] = simplefit_dataset;
net = feedforwardnet(10);
net = train(net,x,t);
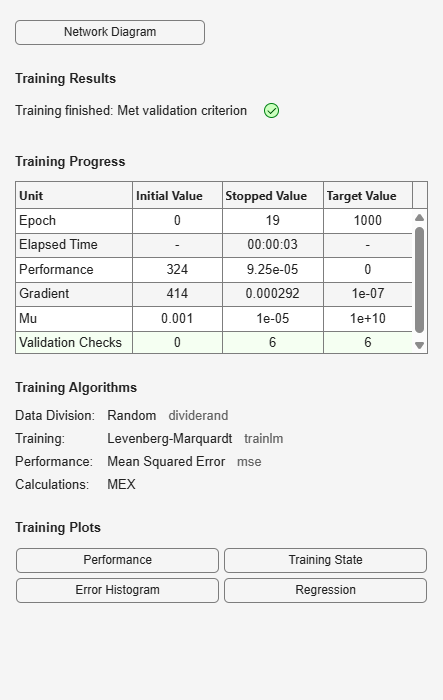
y = net(x);
plotregression(t,y,'Regression')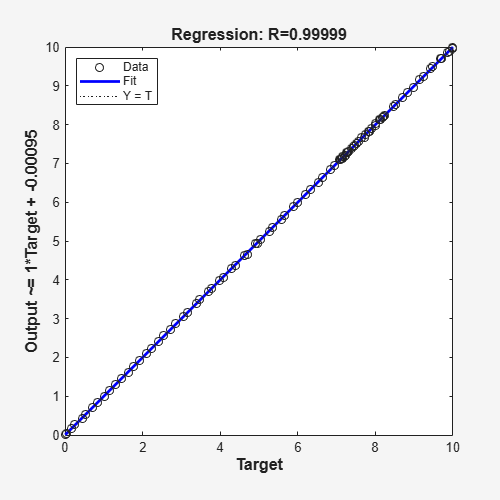
Eingabeargumente
Versionsverlauf
Eingeführt in R2008aSiehe auch
Time Series Modeler | fitrnet (Statistics and Machine Learning Toolbox) | fitcnet (Statistics and Machine Learning Toolbox) | trainnet | trainingOptions | dlnetwork