Enter Breakpoints and Table Data
Enter Data in Block Parameter Dialog Box
This example shows how to populate a 1-D Lookup Table block using the
parameter dialog box. The lookup table in this example approximates the function
y = x3 over the
range [-3, 3].
Add a 1-D Lookup Table block to a model.
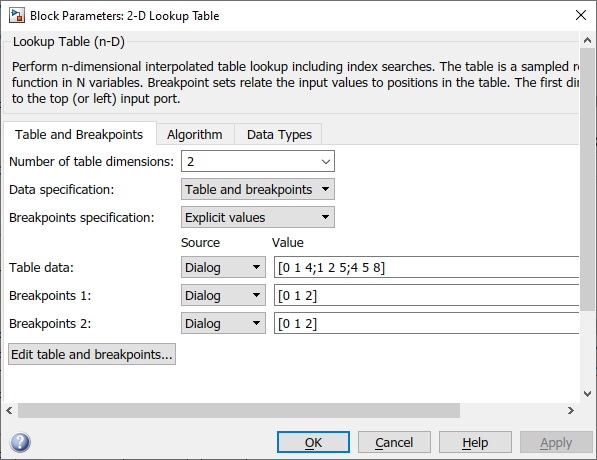
In the 1-D Lookup Table block dialog box, enter the table dimensions and table data:
Set Number of table dimensions to
1.Set Table data to
[-27 -8 -1 0 1 8
                                    27]
.
Alternatively, to use an existing lookup table (
Simulink.LookupTable) object, select Data specification > Lookup table object.Enter the breakpoint vector using one of two methods:
To specify evenly spaced data points, set Breakpoint specification to
Even
                                        spacing
. Set First point to-3and Spacing to1. The block calculates the number of evenly spaced breakpoints based on the table data.To specify breakpoint data explicitly, set Breakpoint specification to
Explicit valuesand set Breakpoints 1 to[-3:3].
Enter Data in Lookup Table Editor
This example shows how to populate a 2-D Lookup Table block using the
Lookup Table Editor. In this example, the lookup table approximates the function
z = x2 +
y2 over the input ranges
x = [0, 2] and y = [0, 2].
Add a 2-D Lookup Table block to a model.
Open the Lookup Table Editor. For example, open the block dialog box and click Edit table and breakpoints.
Click in the lookup table path browser. Any models that contain lookup tables appear.
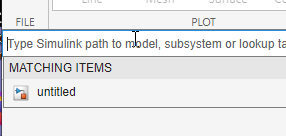
Select
untitledand press Enter.In the hierarchy pane, navigate to the 2-D Lookup Table block.
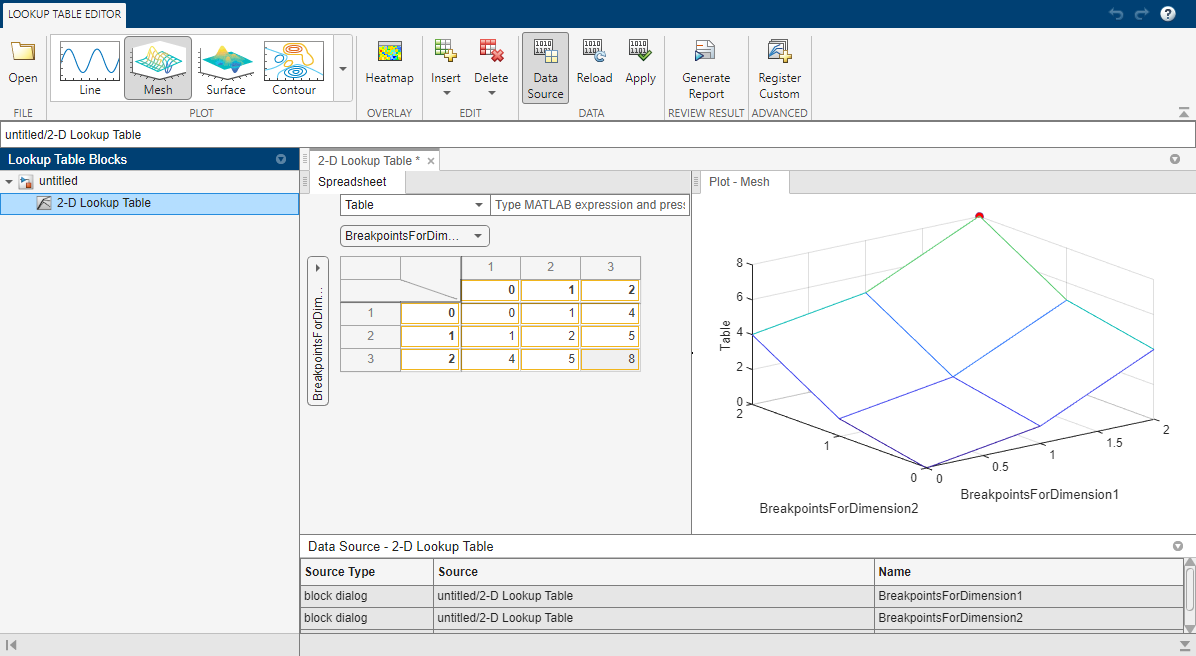
The lookup table spreadsheet appears on the right.
In the spreadsheet, enter the breakpoint vectors and table data in the appropriate cells. To change data, click a cell, enter the new value, and press Enter.
In the cells associated with the BreakpointsForDimension1, enter each of the values
[0 1 2].In the cells associated with the BreakpointsForDimension2, enter each of the values
[0 1 2].In the table data cells, enter the values in the array
[0
                                    1 4; 1 2 5; 4 5 8]
.
Notice that each value you edit appears as a red dot in the plot to the right. As you click a value in the table, the corresponding plot point is highlighted with a red dot.
In the Lookup Table Editor toolstrip, click Apply to update the data in the 2-D Lookup Table block. If the parameter value in the source is specified as a variable name, the applied data updates the variable data, but does not overwrite the string set in the block dialog box.
For more information on using the lookup table spreadsheet, see Edit Lookup Table Data with Lookup Table Spreadsheet.
Enter Data for Multiple Lookup Tables in Lookup Table Editor
This example builds on the Enter Data in Lookup Table Editor example.
Open another model that contains one or more lookup tables, for example,
openExample('sldemo_fuelsys').In the lookup table path browser, type the name of the new model, for example,
sldemo_fuelsys.Select
sldemo_fuelsys, then press Enter.The hierarchy contains two systems that contain lookup tables.
Navigate through the
sldemo_fuelsysnode and select a lookup table to edit.
Enter Data Using Inports of Lookup Table Dynamic Block
This example shows how to populate a Lookup Table Dynamic block using
the inports of the block. In this example, the lookup table approximates the
function y = 3x2
over the range [0, 10].
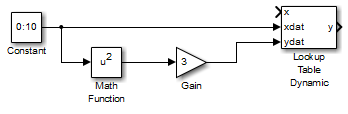
Add a Lookup Table Dynamic block to a model.
Copy the blocks needed to implement the equation y = 3x2 to the Simulink® model:
One Constant block to define the input range, from the Sources library
One Math Function block to square the input range, from the Math Operations library
One Gain block to multiply the signal by 3, also from the Math Operations library
Assign these values to the Constant, Math Function, and Gain blocks using their dialog boxes.
Block Parameter Value Constant Constant value 0:10Math Function Function squareGain Gain 3Input the breakpoint vector to the Lookup Table Dynamic block by connecting the output port of the Constant block to the input port labeled xdat of the Lookup Table Dynamic block. This signal is the input breakpoint vector for x.
Input the table data to the Lookup Table Dynamic block by branching the output signal from the Constant block and connecting it to the Math Function block. Then connect the Math Function block to the Gain block. Finally, connect the Gain block to the input port of the Lookup Table Dynamic block labeled ydat. This signal is the table data for y.