Create Response Plots in Control System Tuner
This example shows how to create response plots for analyzing system performance in Control System Tuner. Control System Tuner can generate many types of response plots in the time and frequency domains. You can view responses of SISO or MIMO transfer functions between inputs and outputs at any location in your model. When you tune your control system, Control System Tuner updates the response plots to reflect the tuned design. Use response plots to validate the performance of the tuned control system.
This example creates response plots for analyzing the sample model
rct_helico. For an example that tunes this controller, see Tune a Control System Using Control System Tuner.
Choose Response Plot Type
In Control System Tuner, in the Control System tab,
click ![]() New Plot. Select the type of plot you want to create.
New Plot. Select the type of plot you want to create.
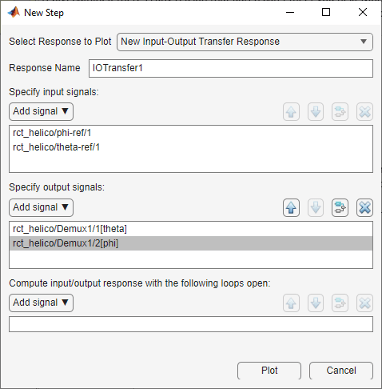
A new plot dialog box opens in which you specify the inputs and outputs of the portion of your control system whose response you want to plot. For example, select New step to create a step response plot from specified inputs to specified outputs of your system.

Specify Transfer Function
Choose which transfer function associated with the specified inputs and outputs you want to analyze.
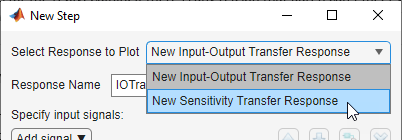
For most response plots types, the Select Response to Plot menu lets you choose one of the following transfer functions:
New Input-Output Transfer Response— Transfer function between specified inputs and outputs, computed with loops open at any additionally specified loop-opening locations.New Sensitivity Transfer Response— Sensitivity function computed at the specified location and with loops open at any specified loop-opening locations.New Open-Loop Response— Open loop point-to-point transfer function computed at the specified location and with loops open at any additionally specified loop-opening locations.Entire System Response— For Pole/Zero maps and I/O Pole/Zero maps only. Plot the pole and zero locations for the entire closed-loop control system.Response of Tuned Block— For Pole/Zero maps and I/O Pole/Zero maps only. Plot the pole and zero locations of tuned blocks.
Name the Response
Type a name for the response in the Response Name text box. Once you have specified signal locations defining the response, Control System Tuner stores the response under this name. When you create additional new response plots, the response appears by this name in Select Response to Plot menu.
Choose Signal Locations for Evaluating System Response
Specify the signal locations in your control system at which to evaluate the selected response. For example, the step response plot displays the response of the system at one or more output locations to a unit step applied at one or more input locations. Use the Specify input signals and Specify output signals sections of the dialog box to specify these locations. (Other tuning goal types, such as loop-shape or stability margins, require you to specify only one location for evaluation. The procedure for specifying the location is the same as illustrated here.)
Under Specify input signals, click ![]() Add signal to list. A list of available input locations appears.
Add signal to list. A list of available input locations appears.
If the signal you want to designate as a step-response input is in the list, click the signal to add it to the step-response inputs. If the signal you want to designate does not appear, and you are tuning a Simulink® model, click Select signal from model.
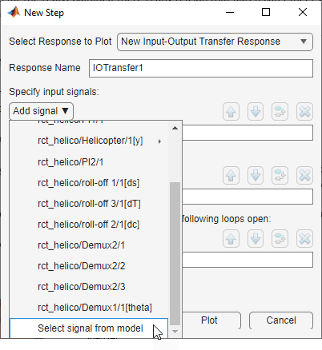
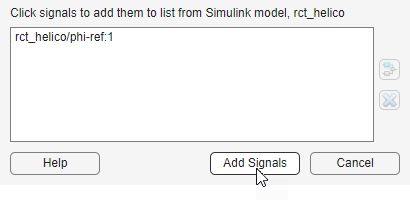
In the Select signals dialog box, build a list of the signals you want. To do so, click signals in the Simulink model editor. The signals that you click appear in the Select signals dialog box. Click one signal to create a SISO response, and click multiple signals to create a MIMO response.
Click Add signal(s). The Select signals dialog box closes.
The signal or signals you selected now appear in the list of step-response inputs in the new-plot dialog box.
Similarly, specify the locations at which the step response is measured to the
step-response outputs list. For example, the following configuration plots the MIMO
response to a step input applied at theta-ref and
phi-ref and measured at theta and
phi in the Simulink model rct_helico.
Tip
To highlight any selected signal in the Simulink model, click ![]() . To remove a signal from the input or output list,
click
. To remove a signal from the input or output list,
click ![]() . When you have selected multiple signals, you can
reorder them using
. When you have selected multiple signals, you can
reorder them using ![]() and
and ![]() .
.
Specify Loop Openings
You can evaluate most system responses with loops open at one or more locations in the
control system. Click ![]() Add loop opening location to list to
specify such locations for the response.
Add loop opening location to list to
specify such locations for the response.
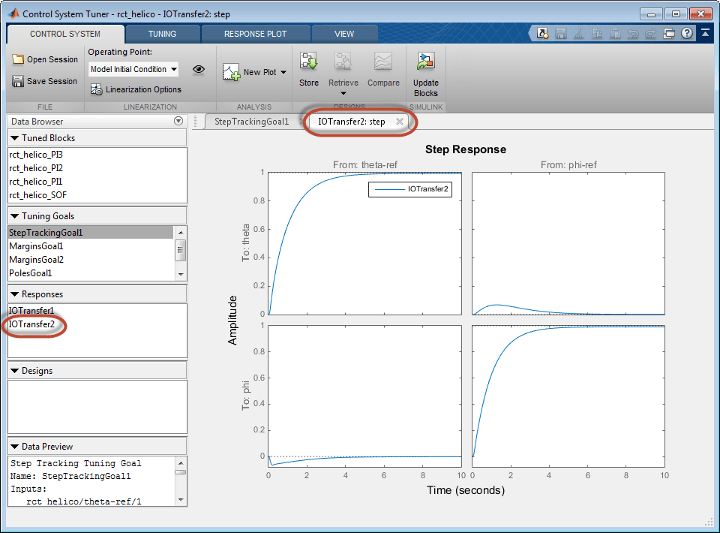
Store and Plot the Response
When you have finished specifying the response, click Plot in the new plot dialog box. The new response appears in the Responses section of the Data Browser. A new figure opens displaying the response plot. When you tune your control system, you can refer to this figure to evaluate the performance of the tuned system.
Tip
To edit the specifications of the response, double-click the response in the Data Browser. Any plots using that response update to reflect the edited response.
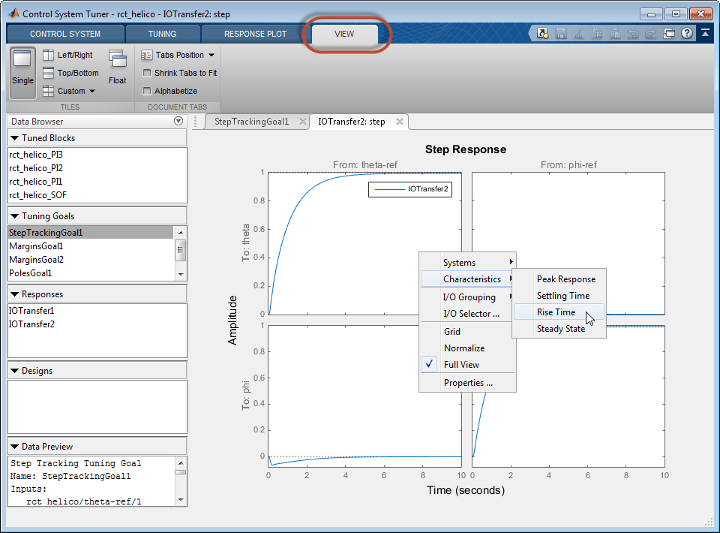
View response characteristics such as rise-times or peak values by right-clicking on the plot. Other options for managing and organizing multiple plots are available in the View tab.