
how can i insert photo to a graph location

Hello all,
i try to insert a photo to axes in GUI. In these axes, only the image will be seen but the axis of the graph will not be visible. how can I do that?
if handles.POP_photo == 2
axes(handles.photo);
imshow('asd.jpg');
end
thanks

 Akzeptierte Antwort

Cris LaPierre
Cris LaPierre am 23 Jan. 2022
This is the default behavior when displaying an image in an axes. You can turn the axis back on using the following syntax: axis(handles.axes1,'on')
Here's an example of equivalent steps outside of a gui.
img = imread('peppers.png');
imshow(img)
axis on


3 Kommentare

Cem Eren Aslan
Cem Eren Aslan am 24 Jan. 2022
thanks. it works but how can i get rid off axis?
Cris LaPierre
Cris LaPierre am 24 Jan. 2022
I am confused. In your original question, you asked how to show the axis. Now you want to get rid of it? Could you be a little more descriptive in what you are trying to do?
axis('on', 'image'); % Show tick marks and tick labels.
axis('off', 'image'); % Hide tick marks and tick labels.

Melden Sie sich an, um zu kommentieren.

Weitere Antworten (2)

Voss
Voss am 23 Jan. 2022
Verschoben: Image Analyst am 21 Mär. 2023
Doesn't imshow() do it?
ax1 = subplot(2,1,1);
ax2 = subplot(2,1,2);
axes(ax1);
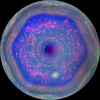
imshow('Saturn_Hexagon.png'); % image showing in ax1; no lines or ticks showing in ax1
Image Analyst
Image Analyst am 24 Jan. 2022
To put an image onto a graph, see this demo:
% Draw a small image inset in the upper right corner of a larger plot.
% Ref: https://www.mathworks.com/matlabcentral/answers/60376-how-to-make-an-inset-of-matlab-figure-inside-the-figure#comment_654093
clc; % Clear the command window.
close all; % Close all figures (except those of imtool.)
clear; % Erase all existing variables. Or clearvars if you want.
%workspace; % Make sure the workspace panel is showing.
format long g;
format compact;
fontSize = 18;
x = linspace(0, 1);
y1 = sin(2*pi*x);
%figure(1)
% plot on large axes
plot(x, y1, 'LineWidth', 2)
grid on;
ax1 = gca; % Store handle to axes 1.
% Create smaller axes in top right, and plot on it
% Store handle to axes 2 in ax2.
ax2 = axes('Position',[.6 .6 .3 .3])
ax2 =
Axes with properties: XLim: [0 1] YLim: [0 1] XScale: 'linear' YScale: 'linear' GridLineStyle: '-' Position: [0.6 0.6 0.3 0.3] Units: 'normalized' Show all properties
box on;
fileName = 'peppers.png';
rgbImage = imread(fileName);
imshow(rgbImage);
axis('on', 'image');
% Now draw something back on axis 1
hold(ax1, 'on'); % Don't blow away existing curve.
y2 = cos(2*pi*x/0.7);
plot(ax1, x, y2, 'r-', 'LineWidth', 2);
Other demos for insets are attached.

Kategorien

Mehr zu Graphics Object Properties finden Sie in Hilfe-Center und File Exchange

Community Treasure Hunt

Find the treasures in MATLAB Central and discover how the community can help you!

Start Hunting!

Translated by