sentenceChart
Syntax
Description
sentenceChart( plots the grammatical
dependency chart of sentence)sentence.
This syntax requires Deep Learning Toolbox™ and the Text Analytics Toolbox™ Model for UDify Data support package. If this support package is not installed, then the function provides a download link.
sentenceChart(
plots the grammatical dependency chart of the sentence using the dependency details encoded
by the tokens token,head,dependency)token, head details head, and
dependency tags dependency.
sentenceChart( plots the grammatical
dependency chart of the sentence using the dependency details encoded by the token details
table tdetails)tdetails.
sentenceChart(___,
specifies additional options using one or more name-value arguments.Name=Value)
sentenceChart( creates
the sentence chart in the figure, panel, or tab specified by
parent,___)parent.
sc = sentenceChart(___)DependencyChart object. Use sc to modify
properties of the sentence chart after creating it. For a list of properties, see DependencyChart Properties.
Examples
Create a string containing a single sentence.
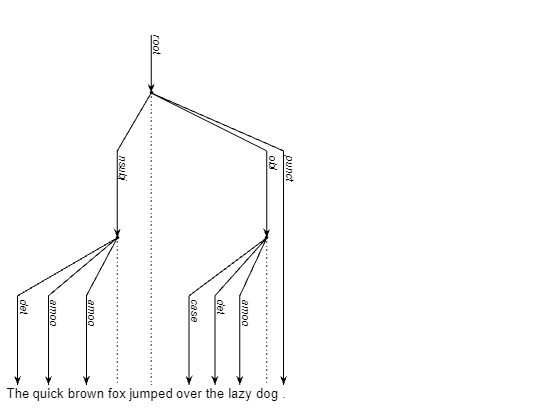
sentence = "The quick brown fox jumped over the lazy dog.";Visualize the dependency details in a sentence chart. Solid lines indicate dependencies and dotted lines indicate subtree labels.
figure
sentenceChart(sentence)

Create a tokenized document object containing a single sentence.
str = "The quick brown fox jumped over the lazy dog.";
sentence = tokenizedDocument(str)
document = tokenizedDocument: 10 tokens: The quick brown fox jumped over the lazy dog .
Visualize the dependency details in a sentence chart. Solid lines indicate dependencies and dotted lines indicate subtree labels.
figure
sentenceChart(sentence)
For long sentences, it can be easier to visualize the sentence structure if you orient the chart vertically.
Create a tokenized document object containing a single sentence.
str = "The particularly quick brown and white fox swiftly " + ...
    "jumped over the unbelievably lazy fluffy dog with big eyes.";
sentence = tokenizedDocument(str)
document =
  tokenizedDocument:

   19 tokens: The particularly quick brown and white fox swiftly jumped over the unbelivably lazy fluffy dog with big eyes .
Visualize the dependency details in a sentence chart. For readability, orient the sentence chart vertically by setting the Orientation option to "vertical". Solid lines indicate dependencies and dotted lines indicate subtree labels.
figure
sentenceChart(sentence,Orientation="vertical")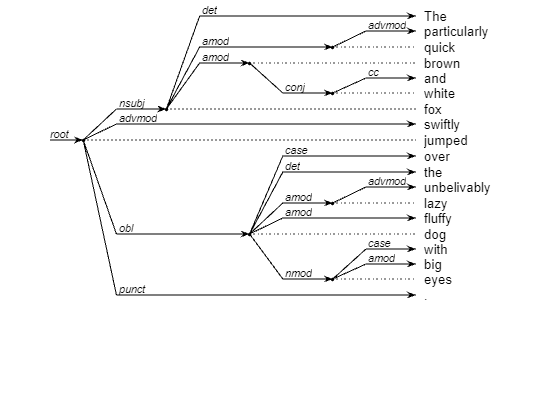
Input Arguments
Name-Value Arguments
Specify optional pairs of arguments as
Name1=Value1,...,NameN=ValueN, where Name is
the argument name and Value is the corresponding value.
Name-value arguments must appear after other arguments, but the order of the
pairs does not matter.
Example: sentenceChart(sentence,Orientation="vertical") plots the
dependency chart of sentence with tokens oriented
vertically.
The DependencyChart properties listed here are only a subset. For a
complete list, see DependencyChart Properties.
Display orientation of the sentence, specified as one of these values:
"horizontal"— Display the tokens horizontally with the tree reading from top to bottom."vertical"— Display the tokens vertically with the tree reading from left to right.
Dependency line width in points, specified as a positive scalar. One point equals 1/72 inch.
The line width cannot be thinner than the width of a pixel. If you set the line width to a value that is less than the width of a pixel on your system, the line displays as one pixel wide.
Note
If you do not specify LeaderLineWidth, then the function
automatically sets LeaderLineWidth to the value of
LineWidth. To change the dependency line width only, set
LeaderLineWidth to 0.5.
Dependency line color, specified as an RGB triplet or as a string scalar or character vector containing a color name.
RGB triplets and hexadecimal color codes are useful for specifying custom colors.
An RGB triplet is a three-element row vector whose elements specify the intensities of the red, green, and blue components of the color. The intensities must be in the range
[0,1]; for example,[0.4 0.6 0.7].A hexadecimal color code is a character vector or a string scalar that starts with a hash symbol (
#) followed by three or six hexadecimal digits, which can range from0toF. The values are not case sensitive. Thus, the color codes"#FF8800","#ff8800","#F80", and"#f80"are equivalent.
Alternatively, you can specify some common colors by name. This table lists the named color options, the equivalent RGB triplets, and hexadecimal color codes.
| Color Name | Short Name | RGB Triplet | Hexadecimal Color Code | Appearance |
|---|---|---|---|---|
"red" | "r" | [1 0 0] | "#FF0000" |
|
"green" | "g" | [0 1 0] | "#00FF00" |
|
"blue" | "b" | [0 0 1] | "#0000FF" |
|
"cyan"
| "c" | [0 1 1] | "#00FFFF" |
|
"magenta" | "m" | [1 0 1] | "#FF00FF" |
|
"yellow" | "y" | [1 1 0] | "#FFFF00" |
|
"black" | "k" | [0 0 0] | "#000000" |
|
"white" | "w" | [1 1 1] | "#FFFFFF" |
|
This table lists the default color palettes for plots in the light and dark themes.
| Palette | Palette Colors |
|---|---|
Before R2025a: Most plots use these colors by default. |
|
|
|
You can get the RGB triplets and hexadecimal color codes for these palettes using the orderedcolors and rgb2hex functions. For example, get the RGB triplets for the "gem" palette and convert them to hexadecimal color codes.
RGB = orderedcolors("gem");
H = rgb2hex(RGB);
Before R2023b: Get the RGB triplets using RGB =
get(groot,"FactoryAxesColorOrder").
Before R2024a: Get the hexadecimal color codes using H =
compose("#%02X%02X%02X",round(RGB*255)).
Dependency line style, specified as one of the options in this table.
| Line Style | Description | Resulting Line |
|---|---|---|
"-" | Solid line |
|
"--" | Dashed line |
|
":" | Dotted line |
|
"-." | Dash-dotted line |
|
"none" | No line | No line |
Leader line width in points, specified as a positive scalar. One point equals 1/72 inch.
The line width cannot be thinner than the width of a pixel. If you set the line width to a value that is less than the width of a pixel on your system, the line displays as one pixel wide.
Leader line color, specified as an RGB triplet or as a string scalar or character vector containing a color name.
RGB triplets and hexadecimal color codes are useful for specifying custom colors.
An RGB triplet is a three-element row vector whose elements specify the intensities of the red, green, and blue components of the color. The intensities must be in the range
[0,1]; for example,[0.4 0.6 0.7].A hexadecimal color code is a character vector or a string scalar that starts with a hash symbol (
#) followed by three or six hexadecimal digits, which can range from0toF. The values are not case sensitive. Thus, the color codes"#FF8800","#ff8800","#F80", and"#f80"are equivalent.
Alternatively, you can specify some common colors by name. This table lists the named color options, the equivalent RGB triplets, and hexadecimal color codes.
| Color Name | Short Name | RGB Triplet | Hexadecimal Color Code | Appearance |
|---|---|---|---|---|
"red" | "r" | [1 0 0] | "#FF0000" |
|
"green" | "g" | [0 1 0] | "#00FF00" |
|
"blue" | "b" | [0 0 1] | "#0000FF" |
|
"cyan"
| "c" | [0 1 1] | "#00FFFF" |
|
"magenta" | "m" | [1 0 1] | "#FF00FF" |
|
"yellow" | "y" | [1 1 0] | "#FFFF00" |
|
"black" | "k" | [0 0 0] | "#000000" |
|
"white" | "w" | [1 1 1] | "#FFFFFF" |
|
This table lists the default color palettes for plots in the light and dark themes.
| Palette | Palette Colors |
|---|---|
Before R2025a: Most plots use these colors by default. |
|
|
|
You can get the RGB triplets and hexadecimal color codes for these palettes using the orderedcolors and rgb2hex functions. For example, get the RGB triplets for the "gem" palette and convert them to hexadecimal color codes.
RGB = orderedcolors("gem");
H = rgb2hex(RGB);
Before R2023b: Get the RGB triplets using RGB =
get(groot,"FactoryAxesColorOrder").
Before R2024a: Get the hexadecimal color codes using H =
compose("#%02X%02X%02X",round(RGB*255)).
Leader line style, specified as one of the options in this table.
| Line Style | Description | Resulting Line |
|---|---|---|
"-" | Solid line |
|
"--" | Dashed line |
|
":" | Dotted line |
|
"-." | Dash-dotted line |
|
"none" | No line | No line |
Token and label font name, specified as a supported font name. For labels to display and print properly, you must choose a font that your system supports. The default font depends on the specific operating system and locale. For example, Windows® and Linux® systems in English localization use the Helvetica font by default.
Data Types: char | string
Token font size in points, specified as a positive scalar. One point equals 1/72 inch.
Note
If you do not specify the LabelFontSize option, then the function automatically sets the LabelFontSize option to 0.8*LineWidth. To change the token font size only, set the LabelFontSize option to 8.
Data Types: single | double | int8 | int16 | int32 | int64 | uint8 | uint16 | uint32 | uint64
Label font name, specified as a supported font name. For labels to display and print properly, you must choose a font that your system supports. The default font depends on the specific operating system and locale. For example, Windows and Linux systems in English localization use the Helvetica font by default.
Data Types: char | string
Label font size in points, specified as a positive scalar. One point equals 1/72 inch.
Data Types: single | double | int8 | int16 | int32 | int64 | uint8 | uint16 | uint32 | uint64
Output Arguments
Version History
Introduced in R2022b