Main Content

textscatter

2-D scatter plot of text

Description

example

ts = textscatter(x,y,str) creates a text scatter plot with elements of str at the locations specified by the vectors x and y, and returns the resulting TextScatter object.

example

ts = textscatter(xy,str) uses locations specified by the rows of xy. This syntax is equivalent to textscatter(xy(:,1),xy(:,2),str).

ts = textscatter(ax,___) plots into axes ax. You can use any input arguments from previous syntaxes.

ts = textscatter(___,Name,Value) specifies additional TextScatter properties using one or more name-value pair arguments.

Examples

collapse all

Plot a string array of numbers at random points on a text scatter plot.

x = rand(50,1);
y = rand(50,1);
str = string(1:50);
figure
textscatter(x,y,str);

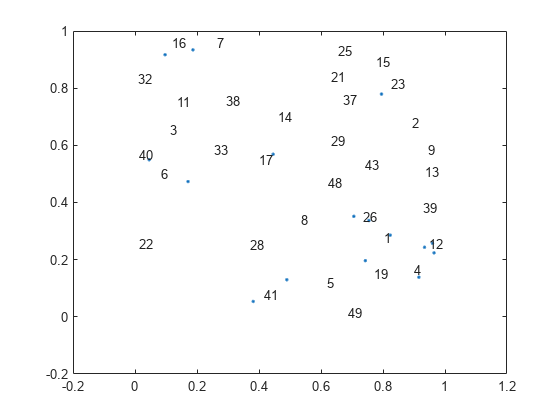
Alternatively, you can pass the coordinates x and y as a matrix xy, where x and y are the columns of xy.

xy = [x y];
figure
textscatter(xy,str)

Create text scatter plot of a word embedding and specify word colors.

Load a pretrained word embedding using fastTextWordEmbedding. This function requires Text Analytics Toolbox™ Model for fastText English 16 Billion Token Word Embedding support package. If this support package is not installed, then the function provides a download link.

emb = fastTextWordEmbedding
emb = 
  wordEmbedding with properties:

     Dimension: 300
    Vocabulary: [1×1000000 string]

Convert the first 500 words to vectors using word2vec. V is a matrix of word vectors of length 300.

words = emb.Vocabulary(1:500);
V = word2vec(emb,words);
size(V)
ans = 1×2

   500   300

Embed the word vectors in two-dimensional space using tsne.

XY = tsne(V);

Plot the words at the coordinates specified by XY in a 2-D text scatter plot. Specify the word colors to be random.

numWords = numel(words);
colorData = rand(numWords,3);
figure
textscatter(XY,words,'ColorData',colorData)
title("Word Embedding t-SNE Plot")

Input Arguments

collapse all

x values, specified as a vector. x, y, and str must be of equal length.

Example: [1 2 3]

y values, specified as a vector. x, y, and str must be of equal length.

Example: [1 2 3]

x and y values, specified as a matrix with two columns. xy(i,1) and xy(i,2) correspond to the x and y values of the ith element of str, respectively. xy must have the numel(str) rows.

textscatter(xy,str) is equivalent to textscatter(xy(:,1),xy(:,2),str).

Example: [1 2 3]

Input text, specified as a string vector or cell array of character vectors. x, y, and str must be of equal length.

Example: ["one" "two" "three"]

Data Types: string | cell

Axes object. If you do not specify an axes object, then the function uses the current axes.

Name-Value Arguments

Specify optional pairs of arguments as Name1=Value1,...,NameN=ValueN, where Name is the argument name and Value is the corresponding value. Name-value arguments must appear after other arguments, but the order of the pairs does not matter.

Before R2021a, use commas to separate each name and value, and enclose Name in quotes.

Example: 'Marker','*' specifies the markers to be asterisks.

The TextScatter object properties listed here are only a subset. For a complete list, see TextScatter Properties.

Percentage of text data to show, specified as a scalar from 0 through 100. To show all text, set TextDensityPercentage to 100. To show no text, set TextDensityPercentage to 0.

If you set TextDensityPercentage to 100, then the software does not plot markers.

Example: 70

Maximum length of text labels, specified as a positive integer. The software truncates the text labels to this length and adds ellipses at the point of truncation.

Example: 10

Marker colors, specified as one of these values:

  • 'auto' — For each marker, use the same color as the corresponding text labels.

  • 'none' — Do not show markers.

  • RGB triplet — Use the same color for all the markers in the plot. An RGB triplet is a three-element row vector whose elements specify the intensities of the red, green, and blue components of the color. The intensities must be in the range [0,1]; for example, [0.5 0.6 0.7].

Example: [1 0 0]

Text colors, specified as one of these values:

  • RGB triplet — Use the same color for all the text in the plot. An RGB triplet is a three-element row vector whose elements specify the intensities of the red, green, and blue components of the color. The intensities must be in the range [0,1]; for example, [0.5 0.6 0.7].

  • Three-column matrix of RGB triplets — Use a different color for each text label in the plot. Each row of the matrix defines one color. The number of rows must equal the number of text labels.

  • Categorical vector — Use a different color for each category in the vector. Specify ColorData as a vector the same length as XData. Specify the colors for each category using the Colors property

Example: [1 0 0; 0 1 0; 0 0 1]

Category colors, specified as a matrix of RGB triplets. An RGB triplet is a three-element row vector whose elements specify the intensities of the red, green, and blue components of the color. The intensities must be in the range [0,1]; for example, [0.5 0.6 0.7].

By default, Colors is equal to the ColorOrder property of the axes object.

Example: [1 0 0; 0 1 0; 0 0 1]

Output Arguments

collapse all

TextScatter object. Use ts to access and modify properties of the text scatter chart after it has been created. For more information, see TextScatter Properties.

Version History

Introduced in R2017b