fcontour
Plot contours of symbolic expression
Syntax
Description
fcontour( plots
the contour lines of symbolic expression f(x,y) over
the default interval of f)x and y,
which is [-5 5].
fcontour(
plots f,[xmin xmax
ymin ymax])f over the interval xmin <
x < xmax and
ymin < y <
ymax. The fcontour function uses
symvar to order the variables and assign intervals.
fcontour(___, uses LineSpec)LineSpec to
set the line style and color. fcontour doesn’t
support markers.
fcontour(___, specifies
line properties using one or more Name,Value)Name,Value pair
arguments. Use this option with any of the input argument combinations
in the previous syntaxes. Name,Value pair settings
apply to all the lines plotted. To set options for individual plots,
use the objects returned by fcontour.
fcontour( plots
into the axes object ax,___)ax instead of the current
axes object gca.
fc = fcontour(___)
Examples
Input Arguments
Name-Value Arguments
Output Arguments
Algorithms
fcontour assigns the symbolic variables
in f to the x-axis, then the y-axis,
and symvar determines the order of the variables to be assigned. Therefore, variable
and axis names might not correspond. To force fcontour to assign
x or y to its corresponding axis, create the symbolic
function to plot, then pass the symbolic function to fcontour.
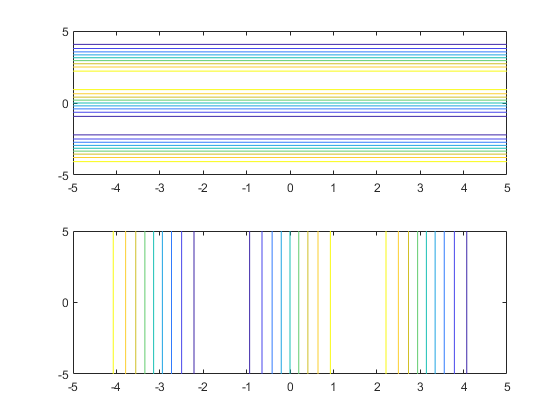
For example, the following code plots the contour of the surface f(x,y) = sin(y) in two ways. The first way forces the waves to oscillate with respect to the y-axis. In other words, the first plot assigns the y variable to the corresponding y-axis. The second plot assigns y to the x-axis because it is the first (and only) variable in the symbolic function.
syms x y;
f(x,y) = sin(y);

figure;
subplot(2,1,1)
fcontour(f);
subplot(2,1,2)
fcontour(f(x,y)); % Or fcontour(sin(y));

Version History
Introduced in R2016a


