ezsurf
(Not recommended) Plot 3-D surface
ezsurf is not recommended. Use fsurf instead.
Syntax
Description
ezsurf( plots a two-variable
symbolic expression or function f)f(x,y)
over the range -2*pi < x < 2*pi, -2*pi < y
< 2*pi.
ezsurf(
plots f,[xmin,xmax,ymin,ymax])f(x,y) over the specified ranges
along the abscissa, xmin < x < xmax, and the ordinate,
ymin < y < ymax.
When determining the range values, ezsurf sorts variables
alphabetically. For example, ezsurf(x^2 - a^3, [0,1,3,6])
plots x^2 - a^3 over
0 < a < 1,
3 < x < 6.
ezsurf( plots the parametric
surface x,y,z)x = x(s,t), y = y(s,t), z
= z(s,t) over the range -2*pi < s < 2*pi,
-2*pi < t < 2*pi.
ezsurf( plots the
parametric surface x,y,z,[smin,smax])x = x(s,t), y = y(s,t),
z
                        = z(s,t)
over the specified range smin < s
< smax.
ezsurf(___, specifies
the grid. You can specify n)n after the input arguments in
any of the previous syntaxes. By default, n = 60.
ezsurf(___,'circ') creates the surface plot
over a disk centered on the range. You can specify'circ'
after the input arguments in any of the previous syntaxes.
Examples
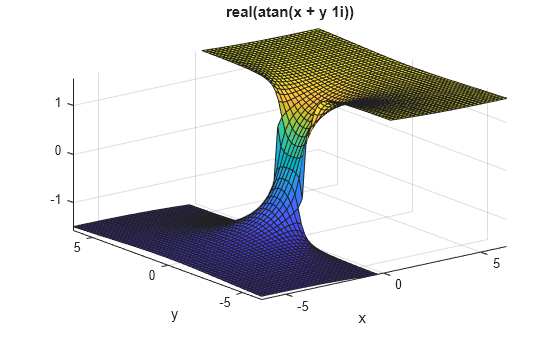
Plot the symbolic function f(x,y) = real(atan(x + i*y)) over the default range -2*pi < x < 2*pi, -2*pi < y < 2*pi.
Create the symbolic function.
syms f(x,y)
f(x,y) = real(atan(x + i*y));
Plot this function using ezsurf.
ezsurf(f)
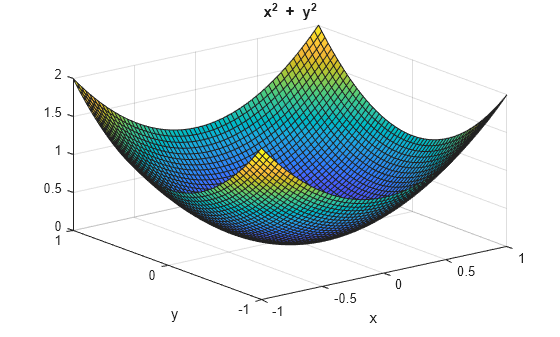
Plot the symbolic expression x^2 + y^2 over the range -1 < x < 1. Because you do not specify the range for the y-axis, ezsurf chooses it automatically.
syms x y
ezsurf(x^2 + y^2, [-1, 1])
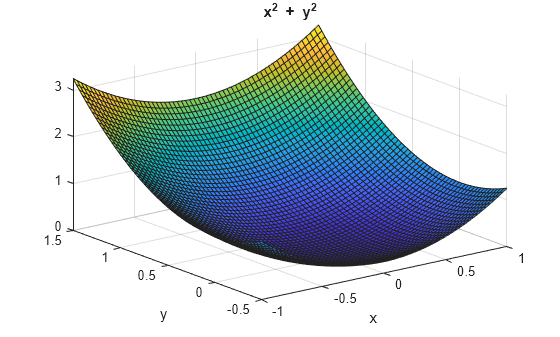
Specify the range for both axes.
ezsurf(x^2 + y^2, [-1, 1, -0.5, 1.5])
Define the parametric surface x(s,t), y(s,t), z(s,t) as follows.
syms s t
r = 2 + sin(7*s + 5*t);
x = r*cos(s)*sin(t);
y = r*sin(s)*sin(t);
z = r*cos(t);
Plot the function using ezsurf.
ezsurf(x, y, z, [0, 2*pi, 0, pi])
title('Parametric surface')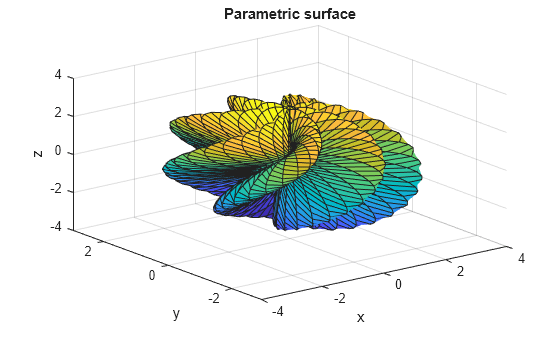
To create a smoother plot, increase the number of mesh points.
ezsurf(x, y, z, [0, 2*pi, 0, pi], 120)
title('Parametric surface with grid = 120')
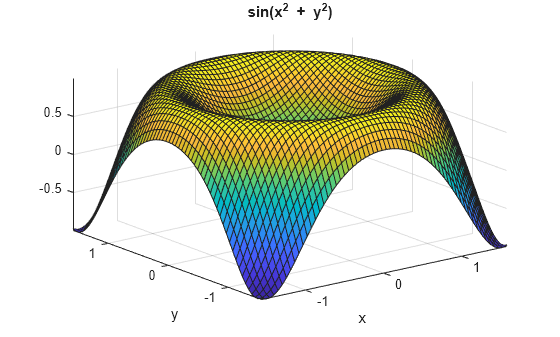
First, plot the expression sin(x^2 + y^2) over the square range -pi/2 < x < pi/2, -pi/2 < y < pi/2.
syms x y
ezsurf(sin(x^2 + y^2), [-pi/2, pi/2, -pi/2, pi/2])
Now, plot the same expression over the disk range.
ezsurf(sin(x^2 + y^2), [-pi/2, pi/2, -pi/2, pi/2],'circ')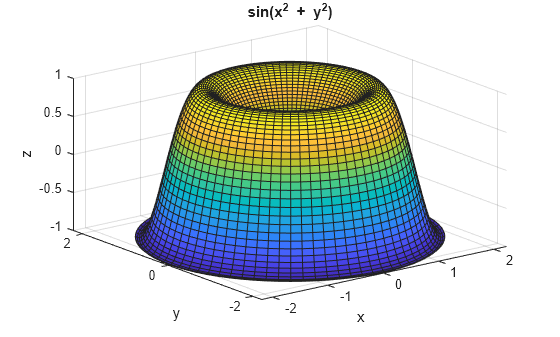
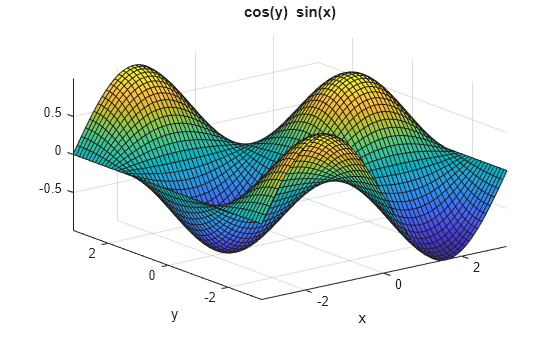
Plot the symbolic expression sin(x)cos(x), and assign the result to the handle h.
syms x y
h = ezsurf(sin(x)*cos(y), [-pi, pi])
h =
  Surface with properties:

       EdgeColor: [0.1294 0.1294 0.1294]
       LineStyle: '-'
       FaceColor: 'flat'
    FaceLighting: 'flat'
       FaceAlpha: 1
           XData: [60×60 double]
           YData: [60×60 double]
           ZData: [60×60 double]
           CData: [60×60 double]

  Show all properties
You can use this handle to change properties of the plot. For example, change the color of the area outline.
h.EdgeColor = 'red'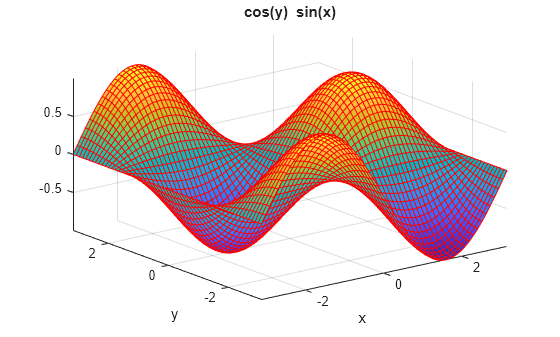
h =
  Surface with properties:

       EdgeColor: [1 0 0]
       LineStyle: '-'
       FaceColor: 'flat'
    FaceLighting: 'flat'
       FaceAlpha: 1
           XData: [60×60 double]
           YData: [60×60 double]
           ZData: [60×60 double]
           CData: [60×60 double]

  Show all properties
Input Arguments
Output Arguments
Tips
ezsurfchooses the computational grid according to the amount of variation that occurs. Iffis singular for some points on the grid, thenezsurfomits these points. The value at these points is set toNaN.
Version History
Introduced before R2006a